

Characterization of palmitoylethanolamide transport in mouse Neuro-2a neuroblastoma and rat RBL-2H3 basophilic leukaemia cells: comparison with anandamide
- PMID: 11309246
- PMCID: PMC1572744
- DOI: 10.1038/sj.bjp.0704029
Characterization of palmitoylethanolamide transport in mouse Neuro-2a neuroblastoma and rat RBL-2H3 basophilic leukaemia cells: comparison with anandamide
Abstract
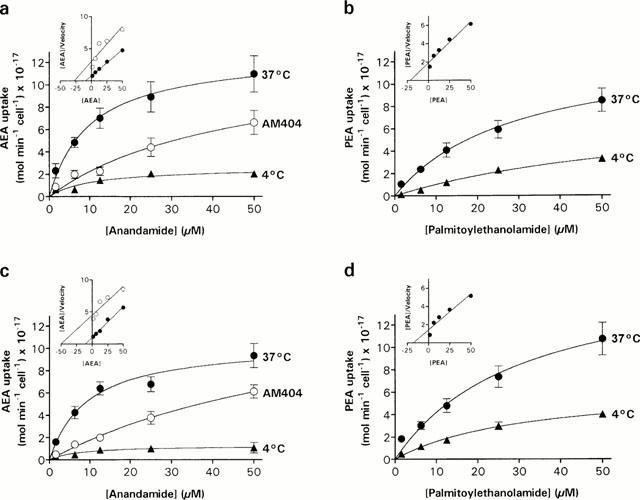
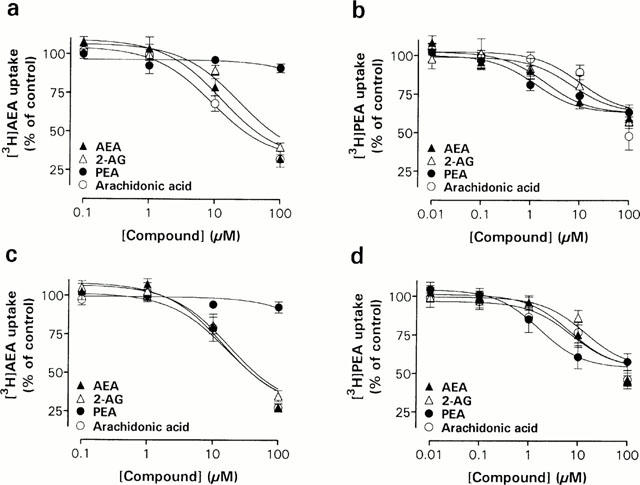
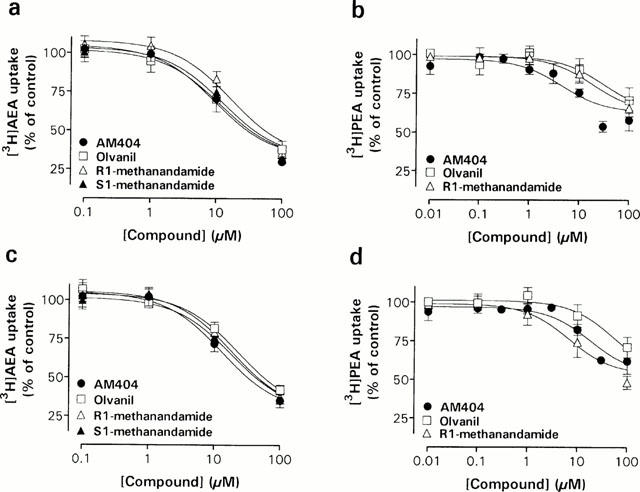
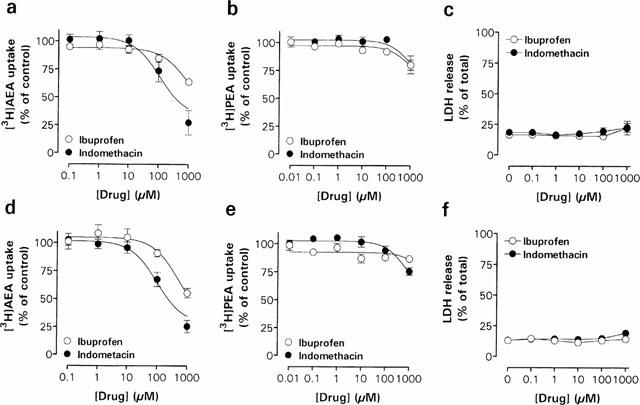
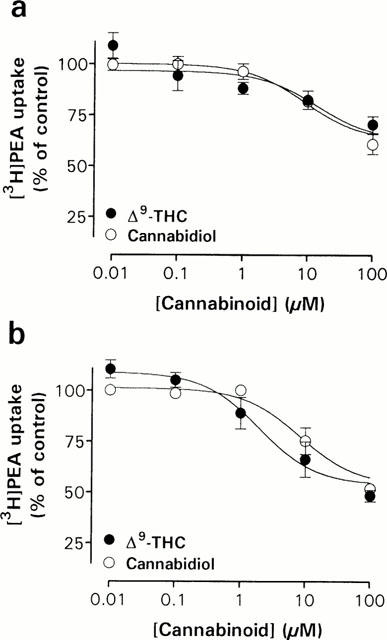
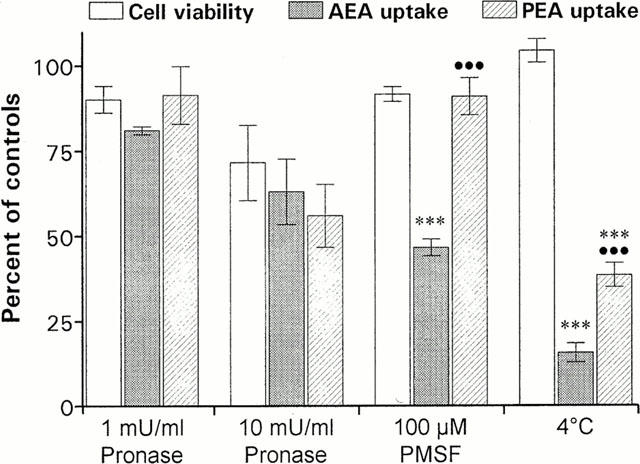
The endogenous cannabinoid receptor agonist anandamide (AEA) and the related compound palmitoylethanolamide (PEA) are inactivated by transport into cells followed by metabolism by fatty acid amide hydrolase (FAAH). The cellular uptake of AEA has been characterized in detail, whereas less is known about the properties of the PEA uptake, in particular in neuronal cells. In the present study, the pharmacological and functional properties of PEA and AEA uptake have been investigated in mouse Neuro-2a neuroblastoma and, for comparison, in rat RBL-2H3 basophilic leukaemia cells. Saturable uptake of PEA and AEA into both cell lines were demonstrated with apparent K(M) values of 28 microM (PEA) and 10 microM (AEA) in Neuro-2a cells, and 30 microM (PEA) and 9.3 microM (AEA) in RBL-2H3 cells. Both PEA and AEA uptake showed temperature-dependence but only the AEA uptake was sensitive to treatment with Pronase and phenylmethylsulfonyl fluoride. The AEA uptake was inhibited by AM404, 2-arachidonoylglycerol (2-AG), R1- and S1-methanandamide, arachidonic acid and olvanil with similar potencies for the two cell types. PEA, up to a concentration of 100 microM, did not affect AEA uptake in either cell line. AEA, 2-AG, arachidonic acid, R1-methanandamide, (9)-THC, and cannabidiol inhibited PEA transport in both cell lines. The non-steroidal anti-inflammatory drug indomethacin inhibited the AEA uptake but had very weak effects on the uptake of PEA. From these data, it can be concluded that PEA is transported in to cells both by passive diffusion and by a facilitated transport that is pharmacologically distinguishable from AEA uptake.
Figures
Similar articles
-
Interactions between synthetic vanilloids and the endogenous cannabinoid system.FEBS Lett. 1998 Oct 9;436(3):449-54. doi: 10.1016/s0014-5793(98)01175-2. FEBS Lett. 1998. PMID: 9801167
-
The novel endogenous cannabinoid 2-arachidonoylglycerol is inactivated by neuronal- and basophil-like cells: connections with anandamide.Biochem J. 1998 Apr 1;331 ( Pt 1)(Pt 1):15-9. doi: 10.1042/bj3310015. Biochem J. 1998. PMID: 9512456 Free PMC article.
-
Cannabimimetic fatty acid derivatives in cancer and inflammation.Prostaglandins Other Lipid Mediat. 2000 Apr;61(1-2):43-61. doi: 10.1016/s0090-6980(00)00054-x. Prostaglandins Other Lipid Mediat. 2000. PMID: 10785541 Review.
-
Cellular transport of anandamide, 2-arachidonoylglycerol and palmitoylethanolamide--targets for drug development?Prostaglandins Leukot Essent Fatty Acids. 2002 Feb-Mar;66(2-3):193-200. doi: 10.1054/plef.2001.0357. Prostaglandins Leukot Essent Fatty Acids. 2002. PMID: 12052035 Review.
-
Palmitoylethanolamide inhibits the expression of fatty acid amide hydrolase and enhances the anti-proliferative effect of anandamide in human breast cancer cells.Biochem J. 2001 Aug 15;358(Pt 1):249-55. doi: 10.1042/0264-6021:3580249. Biochem J. 2001. PMID: 11485574 Free PMC article.
Cited by
-
Effects of homologues and analogues of palmitoylethanolamide upon the inactivation of the endocannabinoid anandamide.Br J Pharmacol. 2001 Aug;133(8):1263-75. doi: 10.1038/sj.bjp.0704199. Br J Pharmacol. 2001. PMID: 11498512 Free PMC article.
-
Molecular targets for cannabidiol and its synthetic analogues: effect on vanilloid VR1 receptors and on the cellular uptake and enzymatic hydrolysis of anandamide.Br J Pharmacol. 2001 Oct;134(4):845-52. doi: 10.1038/sj.bjp.0704327. Br J Pharmacol. 2001. PMID: 11606325 Free PMC article.
-
Cannabinoid-receptor-independent cell signalling by N-acylethanolamines.Biochem J. 2001 Nov 15;360(Pt 1):67-75. doi: 10.1042/0264-6021:3600067. Biochem J. 2001. PMID: 11695993 Free PMC article.
-
Comparison of the Anticancer Effects of Arvanil and Olvanil When Combined with Cisplatin and Mitoxantrone in Various Melanoma Cell Lines-An Isobolographic Analysis.Int J Mol Sci. 2022 Nov 16;23(22):14192. doi: 10.3390/ijms232214192. Int J Mol Sci. 2022. PMID: 36430670 Free PMC article.
-
A catalytically silent FAAH-1 variant drives anandamide transport in neurons.Nat Neurosci. 2011 Nov 20;15(1):64-9. doi: 10.1038/nn.2986. Nat Neurosci. 2011. PMID: 22101642 Free PMC article.
References
-
- ANDERSSON M., JACOBSSON S.O.P., JONSSON K.-O., TIGER G., FOWLER C.J. Neurotoxicity of glutamate in chick telencephalon neurons. Reduction of toxicity by preincubation with carbachol, but not by the endogenous fatty acid amides anandamide and palmitoylethanolamide. Arch. Toxicol. 2000;74:161–164. - PubMed
-
- BELTRAMO M., PIOMELLI D. Anandamide transport inhibition by the vanilloid agonist olvanil. Eur. J. Pharmacol. 1999;364:75–78. - PubMed
-
- BELTRAMO M., STELLA N., CALIGNANO A., LIN S.Y., MAKRIYANNIS A., PIOMELLI D. Functional role of high-affinity anandamide transport, as revealed by selective inhibition. Science. 1997;277:1094–1097. - PubMed
-
- BISOGNO T., MAURELLI S., MELCK D., DE PETROCELLIS L., DI MARZO V. Biosynthesis, uptake, and degradation of anandamide and palmitoylethanolamide in leukocytes. J. Biol. Chem. 1997;272:3315–3323. - PubMed
-
- CALIGNANO A., LA RANA G., BELTRAMO M., MAKRIYANNIS A., PIOMELLI D. Potentiation of anandamide hypotension by the transport inhibitor, AM404. Eur. J. Pharmacol. 1997;337:R1–R2. - PubMed
Publication types
MeSH terms
Substances
LinkOut - more resources
Full Text Sources
Other Literature Sources
Medical
