. 2001 Apr 24;98(9):5363-7.
doi: 10.1073/pnas.081074098. Epub 2001 Apr 17.

Covert attention accelerates the rate of visual information processing

Affiliations

Covert attention accelerates the rate of visual information processing

M Carrasco et al. Proc Natl Acad Sci U S A. .

Abstract

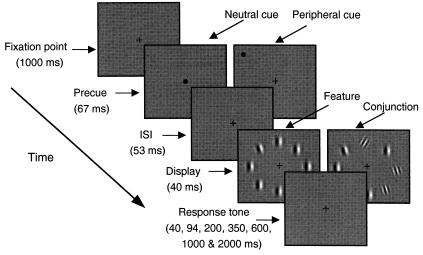
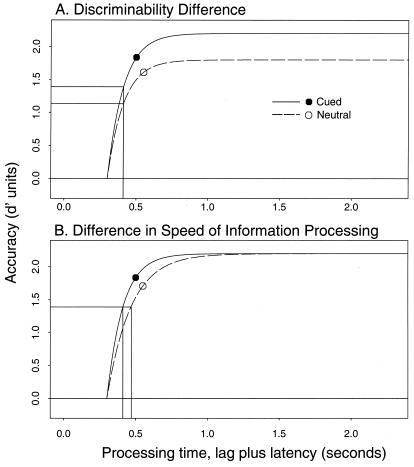
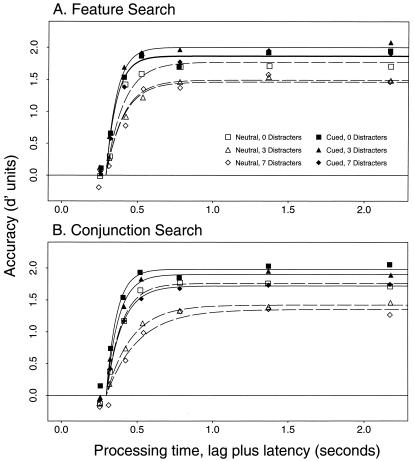
Whenever we open our eyes, we are confronted with an overwhelming amount of visual information. Covert attention allows us to select visual information at a cued location, without eye movements, and to grant such information priority in processing. Covert attention can be voluntarily allocated, to a given location according to goals, or involuntarily allocated, in a reflexive manner, to a cue that appears suddenly in the visual field. Covert attention improves discriminability in a wide variety of visual tasks. An important unresolved issue is whether covert attention can also speed the rate at which information is processed. To address this issue, it is necessary to obtain conjoint measures of the effects of covert attention on discriminability and rate of information processing. We used the response-signal speed-accuracy tradeoff (SAT) procedure to derive measures of how cueing a target location affects speed and accuracy in a visual search task. Here, we show that covert attention not only improves discriminability but also accelerates the rate of information processing.


Figures

Figure 1
Figure 1
Response-signal speed-accuracy trade-off procedure. Sequence of events in a single trial. In both tasks, the 2-cpd target was 30° tilted to the right or left. In the feature task, all of the distracters were vertical 2-cpd patches. In the conjunction task, some distracters shared the orientation of the target and others share its spatial frequency: the 2-cpd distracters were vertical patches; half the 8-cpd distracters were tilted to the left, and half to the right. A small fixation dot was always present at the center of the screen. To implement the SAT procedure, a response tone was presented after the display at varying time lags ranging from 40 to 2000 ms. Feedback was provided after each trial and block. Each of 5 naive observers performed 13,440 experimental trials over 10 sessions.
Figure 2
Figure 2
Hypothetical SAT functions. Illustrative SAT functions, plotted in d′ units (formula image of the standard normal deviate of the probability of correctly judging the target's orientation) versus processing time (time of the response cue plus observer's latency to respond) in seconds. (A) Expected pattern if cueing increases target discriminability only. The functions differ in asymptotic accuracy, but are associated with the same intercept (point when accuracy departs from chance) and proportional rate of information processing. (B) One expected pattern if cueing target location alters the rate of information processing only. The functions display disproportional dynamics; they reach a given proportion of their asymptotes at different times. Circles show hypothetical RT results plotted in SAT coordinates (abscissa = mean RT; ordinate = the accuracy level associated with mean RT), illustrating that RT differences can reflect differences in discriminability (A) or the speed of information processing (B). Approximately the same difference in mean RT and accuracy is consistent with either differences in SAT asymptote (A) or SAT dynamics (B). The position of the RT points on the corresponding SAT functions are determined by the decision criteria that an observer uses to balance speed and accuracy. Here, the hypothetical RT data are shown slightly higher than the 1 − 1/e (63%) point—a position often found in direct comparisons of RT and SAT procedures—illustrating that, in conventional RT tasks, observers often trade modest decrements in accuracy for substantial gains in speed (–30).
Figure 3
Figure 3
Results. Average (over observers) discrimination accuracy (in d′units) as a function of processing time in feature (A) and conjunction (B) searches. Smooth functions show the best-fitting exponential model (Eq. 1) for the cued (solid lines) and neutral (dashed lines) conditions, based on fits of nested models that systematically varied the three parameters of Eq. 1. Quality of fit was determined by the value of an adjusted-R2 statistic (–30), the proportion of variance accounted for adjusted by the number of free parameters, and by the consistency of parameter estimates across observers. The simplest best-fitting model for feature searches allocated a separate asymptotic parameter (λ) to each of the six conditions, one rate (β) parameter to the cued conditions and another to the neutral conditions, and a single intercept (δ) parameter (adjusted-R2 = 0.979 for the average data, ranging from 0.897 to 0.944 across observers). The best-fitting exponential model for conjunction searches allocated a separate asymptotic (λ) and rate (β) parameter to each of the six conditions, and a single intercept (δ) parameter (adjusted-R2 = 0.984 for the average data, ranging from 0.889 to 0.961 across observers). Table 1 shows average parameter values.

References

    1. Carrasco M, Penpeci-Talgar C, Eckstein M. Vision Res. 2000;40:1203–1215. - PMC - PubMed
    1. Lu Z L, Dosher B A. Vision Res. 1998;38:1183–1198. - PubMed
    1. Prinzmetal W, Amiri H, Allen K, Edwards T. J Exp Psychol Hum Percept Perform. 1998;24:1–22.
    1. Yeshurun Y, Carrasco M. Nature (London) 1998;39:672–675.
    1. Yeshurun Y, Carrasco M. Nat Neurosci. 2000;36:22–27. - PubMed

Publication types