. 2001 Apr 24;98(9):5043-8.
doi: 10.1073/pnas.081474898. Epub 2001 Apr 17.

Skp2 is oncogenic and overexpressed in human cancers

Affiliations

Skp2 is oncogenic and overexpressed in human cancers

M Gstaiger et al. Proc Natl Acad Sci U S A. .

Abstract

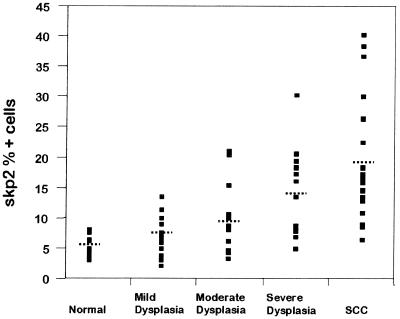
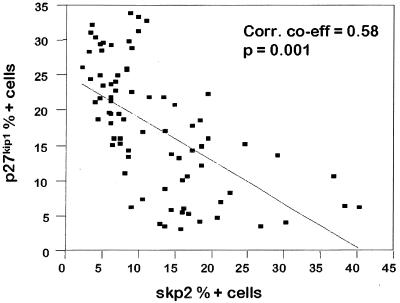
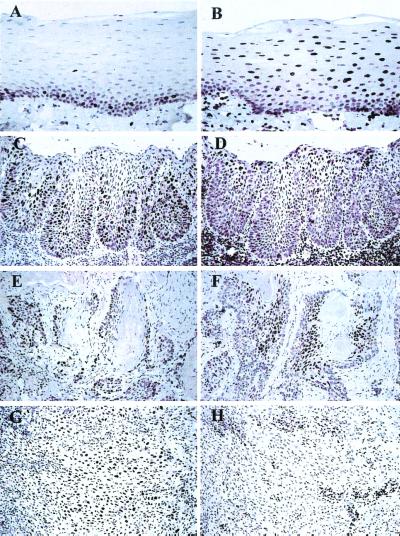
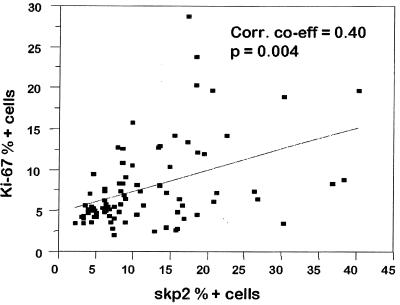
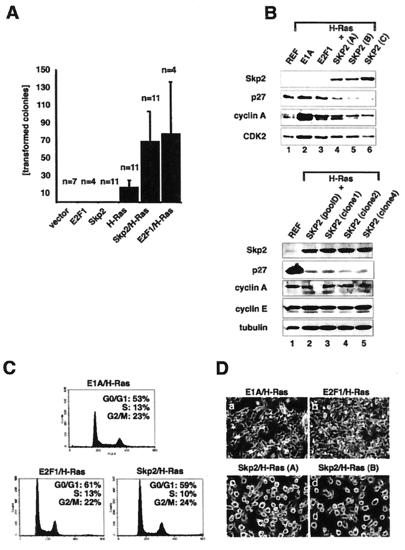
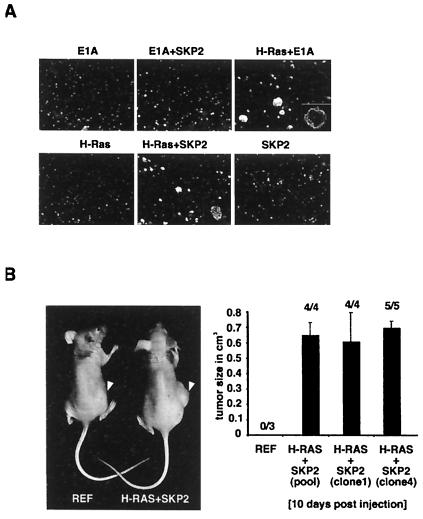
Skp2 is a member of the F-box family of substrate-recognition subunits of SCF ubiquitin-protein ligase complexes that has been implicated in the ubiquitin-mediated degradation of several key regulators of mammalian G(1) progression, including the cyclin-dependent kinase inhibitor p27, a dosage-dependent tumor suppressor protein. In this study, we examined Skp2 and p27 protein expression by immunohistochemistry in normal oral epithelium and in different stages of malignant oral cancer progression, including dysplasia and oral squamous cell carcinoma. We found that increased levels of Skp2 protein are associated with reduced p27 in a subset of oral epithelial dysplasias and carcinomas compared with normal epithelial controls. Tumors with high Skp2 (>20% positive cells) expression invariably showed reduced or absent p27 and tumors with high p27 (>20% positive cells) expression rarely showed Skp2 positivity. Increased Skp2 protein levels were not always correlated with increased cell proliferation (assayed by Ki-67 staining), suggesting that alterations of Skp2 may contribute to the malignant phenotype without affecting proliferation. Skp2 protein overexpression may lead to accelerated p27 proteolysis and contribute to malignant progression from dysplasia to oral epithelial carcinoma. Moreover, we also demonstrate that Skp2 has oncogenic potential by showing that Skp2 cooperates with H-Ras(G12V) to malignantly transform primary rodent fibroblasts as scored by colony formation in soft agar and tumor formation in nude mice. The observations that Skp2 can mediate transformation and is up-regulated during oral epithelial carcinogenesis support a role for Skp2 as a protooncogene in human tumors.


Figures

Figure 1
Figure 1
Distribution of scores for Skp2-positive cells in normal epithelium, in mild, moderate, and severe dysplasia, and in squamous cell carcinomas. The dotted lines indicate the mean for the group.
Figure 2
Figure 2
Scatter plot of Skp2 versus p27 percentage positive cells for epithelial dysplasia and carcinomas. The line of best fit is shown with a Pearson correlation coefficient of 0.58.
Figure 3
Figure 3
Skp2 (A, C, E, and G) and p27 (B, D, F, and H) immunostaining in normal oral mucosa, epithelial dysplasia, and squamous cell carcinoma. Paraffin-embedded tissue sections were stained for Skp2 or p27 and counterstained with hematoxylin. Skp2 staining was performed with an affinity-purified polyclonal anti-Skp2 antibody. (A) Skp2 staining in normal oral epithelium, showing scattered positive cells in the basal and parabasal proliferative layers. (B) p27 staining in normal oral epithelium showing positive cells in the suprabasal, terminally differentiated keratinocytes. (C) Skp2 immunostaining in severe epithelial dysplasia, showing expansion of the number and distribution of the positive cells into the suprabasal layers. (D) p27 staining in severe epithelial dysplasia is reduced and confined to the superficial keratinocytes. (E) Skp2 staining in a well differentiated carcinoma is confined to the peripheral cells of tumor islands. (F) p27 staining is reduced at the periphery of a well differentiated carcinoma but increased in the central areas. (G) Increased Skp2 staining (>20% nuclei positive) in a poorly differentiated carcinoma. (H) p27 immunostaining is markedly reduced with only infiltrating lymphocytes positive.
Figure 4
Figure 4
Scatter plot of Skp2 versus Ki-67 percentage positive cells for epithelial dysplasia and carcinomas. The line of best fit is shown with a Pearson correlation coefficient of 0.40.
Figure 5
Figure 5
Characterization of Skp2/H-RasG12V-transfected primary REFs. (A) REFs were transfected with expression plasmids as indicated and selected in puromycin for 2–3 weeks, and visible colonies were counted. Black bars represent the combined average of transformed colonies per transfection. The numbers of transfection experiments (n) are superimposed on the corresponding bars of the diagram. The vertical lines indicate standard errors. (B) (Upper) Colonies produced by transfection of REFs with H-RasG12V together with E1A, E2F1, or Skp2 were established as uncloned mass cultures. Lysates were prepared from each cell population, equalized for protein content, and processed for Western blotting with anti-Skp2 monoclonal (Top), anti-p27 (Second), anti-cyclin A (Third), or anti-Cdk2 (Bottom) antibodies. Lane 1, normal REFs; lane 2, E1A/H-RasG12V-transformed pool; lane 3, E2F1/H-RasG12V-transformed pool; lanes 4–6, three independently established Skp2/H-RasG12V-transformed pools. (Lower) Colonies produced by transfection of REFs with H-RasG12V together with Skp2 were established as either uncloned mass cultures or clones and processed for Western blotting with anti-Skp2 monoclonal (Top), anti-p27 (Second), anti-cyclin E (Third), anti-cyclin A (Fourth), or anti-tubulin (Bottom) antibodies. Lane 1, normal REFs; lane 2, Skp2/H-RasG12V-transformed pool; lanes 3–5, Skp2/H-RasG12V-transformed clones isolated form independent transfection experiments. (C) Representative mass cultures of transformed cells described for B were processed for flow cytometric analysis. The x axis shows DNA content and the y axis shows the number of cells. The percentages of cells in G0/G1, S, and G2/M are indicated. (D) Representative photomicrograph of established cell pools analyzed in B. (a) E1A/H-RasG12V-transformed pool. (b) E2F1/H-RasG12V-transformed pool. (c and d) Two independently established Skp2/H-RasG12V-transformed pools.
Figure 6
Figure 6
REFs transformed by Skp2 and H-RasG12V grow in soft agar and are tumorigenic. (A) REFs were transfected with expression plasmids as indicated, selected in puromycin, and grown in soft agar. Cells were photographed after 2 weeks in semisolid agarose. Only the results of one pool of the various independently established cultures are shown here. (B) (Left) A tumor in a flank of a mouse injected with Skp2/H-RasG12V-expressing cells (right mouse). Tumors did not appear after injection of nontransfected REFs (left mouse). (Right) Pooled populations or cells of individual clones expressing Skp2 and H-RasG12V were independently injected into nude mice. After 10 days, palpable tumors were measured with a caliper to estimate tumor volume. The numbers on top of each bar represent the proportion of injected mice that had detectable tumors at 10 days after injection. Note that all mice that were injected with Skp2/H-RasG12V-expressing cells formed tumors. The vertical lines indicate standard errors.

References

    1. Sherr C J. Science. 1996;274:1672–1677. - PubMed
    1. Deshaies R J. Annu Rev Cell Dev Biol. 1999;15:435–467. - PubMed
    1. Koepp D M, Harper J W, Elledge S J. Cell. 1999;97:431–434. - PubMed
    1. Sutterlüty H, Chatelain E, Marti A, Wirbelauer C, Senften M, Müller U, Krek W. Nat Cell Biol. 1999;1:207–214. - PubMed
    1. Tsvetkov L M, Yeh K H, Lee S H, Sun H, Zhang H. Curr Biol. 1999;9:661–664. - PubMed

Publication types

MeSH terms