. 2001 Apr 24;98(9):5116-21.
doi: 10.1073/pnas.091062498. Epub 2001 Apr 17.

Significance analysis of microarrays applied to the ionizing radiation response

Affiliations

Significance analysis of microarrays applied to the ionizing radiation response

V G Tusher et al. Proc Natl Acad Sci U S A. .

Erratum in

  • Proc Natl Acad Sci U S A 2001 Aug 28;98(18):10515

Abstract

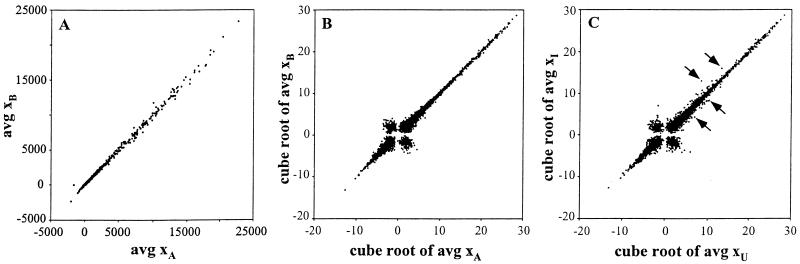
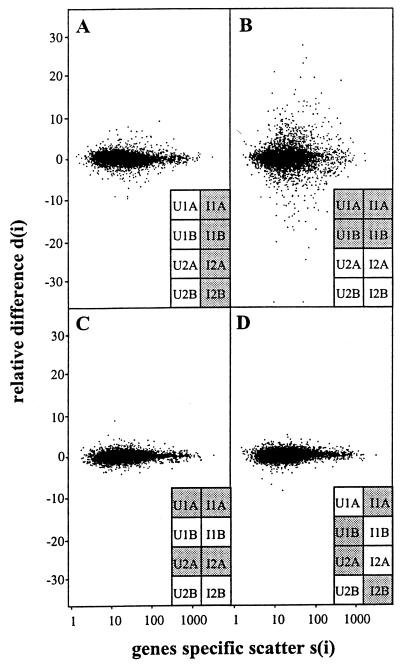
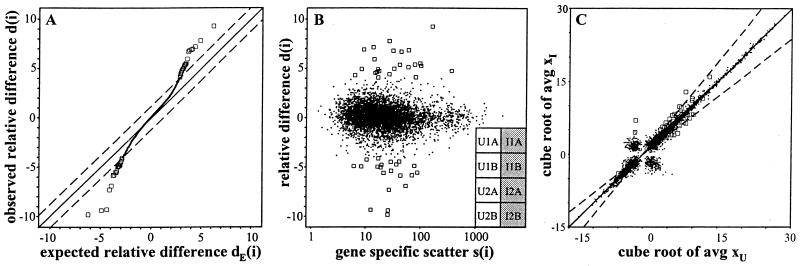
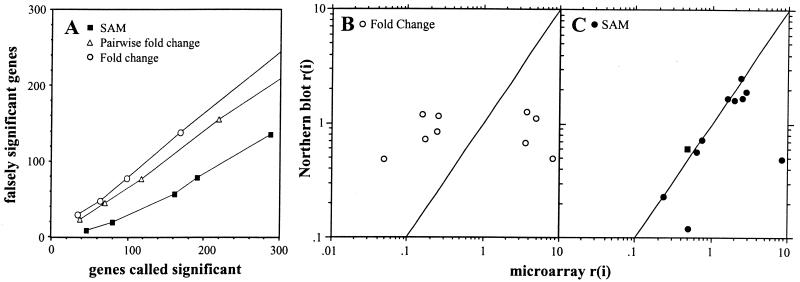
Microarrays can measure the expression of thousands of genes to identify changes in expression between different biological states. Methods are needed to determine the significance of these changes while accounting for the enormous number of genes. We describe a method, Significance Analysis of Microarrays (SAM), that assigns a score to each gene on the basis of change in gene expression relative to the standard deviation of repeated measurements. For genes with scores greater than an adjustable threshold, SAM uses permutations of the repeated measurements to estimate the percentage of genes identified by chance, the false discovery rate (FDR). When the transcriptional response of human cells to ionizing radiation was measured by microarrays, SAM identified 34 genes that changed at least 1.5-fold with an estimated FDR of 12%, compared with FDRs of 60 and 84% by using conventional methods of analysis. Of the 34 genes, 19 were involved in cell cycle regulation and 3 in apoptosis. Surprisingly, four nucleotide excision repair genes were induced, suggesting that this repair pathway for UV-damaged DNA might play a previously unrecognized role in repairing DNA damaged by ionizing radiation.


Figures

Figure 1
Figure 1
Gene expression measured by microarrays. (A) Linear scatter plot of gene expression. Each gene (i) in the microarray is represented by a point with coordinates consisting of average gene expression measured from the four A hybridizations (avg xA) and the average gene expression in the four B hybridizations (avg xB). (B) Cube root scatter plot of gene expression. The average gene expression from the A and B hybridizations have been plotted on a cube root scale to resolve genes expressed at low levels. (C) Cube root scatter plot of average gene expression from the four hybridizations with uninduced cells (avg xU) and induced cells 4 h after exposure to 5 Gy of IR (avg xI). Some of the genes that responded to IR are indicated by arrows.
Figure 2
Figure 2
Scatter plots of relative difference in gene expression d(i) vs. gene-specific scatter s(i). The data were partitioned to calculate d(i), as indicated by the bar codes. The shaded and unshaded entries were used for the first and second terms in the numerator of d(i) in Eq. 1. (A) Relative difference between irradiated and unirradiated states. The statistic d(i) was computed from expression measurements partitioned between irradiated and unirradiated cells. (B) Relative difference between cell lines 1 and 2. The statistic d(i) was computed from expression measurements partitioned between cell lines 1 and 2. (C) Relative difference between hybridizations A and B. The statistic d(i) was computed from the permutation in which the expression measurements were partitioned between the equivalent hybridizations A and B. (D) Relative difference for a permutation of the data that was balanced between cell lines 1 and 2.
Figure 3
Figure 3
Identification of genes with significant changes in expression. (A) Scatter plot of the observed relative difference d(i) versus the expected relative difference dE(i). The solid line indicates the line for d(i) = dE(i), where the observed relative difference is identical to the expected relative difference. The dotted lines are drawn at a distance Δ = 1.2 from the solid line. (B) Scatter plot of d(i) vs. s(i). (C) Cube root scatter plot of average gene expression in induced and uninduced cells. The cutoffs for 2-fold induction and repression are indicated by the dashed lines. In A–C, the 46 potentially significant genes for Δ = 1.2 are indicated by the squares.
Figure 4
Figure 4
Comparison of SAM to conventional methods for analyzing microarrays. (A) Falsely significant genes plotted against number of genes called significant. Of the 57 genes most highly ranked by the fold change method, 5 were included among the 46 genes most highly ranked by SAM. Of the 38 genes most highly ranked by the pairwise fold change method, 11 were included among the 46 genes most highly ranked by SAM. These results were consistent with the FDR of SAM compared to the FDRs of the fold change and pairwise fold change methods. (B) Northern blot validation for genes identified by the fold change method. Values of r(i) are plotted for genes chosen at random from the 57 genes most highly ranked by the fold change method. (C) Validation for genes identified by SAM. Results are plotted for genes chosen at random from the 46 genes most highly ranked by SAM. Genes analyzed by Northern blot are represented by circles. TNF-α was validated by using a PreDeveloped TaqMan assay (PE Biosystems) and is represented by a square. The straight lines in B and C indicate the position of exact agreement between Northern blot and microarray results.

References

    1. Eisen M, Spellman P, Brown P, Botstein D. Proc Natl Acad Sci USA. 1998;95:14863–14868. - PMC - PubMed
    1. Roberts C, Nelson B, Marton M, Stoughton R, Meyer M, Bennett H, He Y, Dai H, Walker W, Hughes T, Tyers M, Boone C, Friend S. Science. 2000;287:873–880. - PubMed
    1. Galitski T, Saldanha A, Styles C, Lander E, Fink G. Science. 1999;285:251–254. - PubMed
    1. Ly D, Lockhart D, Lerner R, Schultz P. Science. 2000;287:2486–2492. - PubMed
    1. Weill D, Gay F, Tovey M, Chouaib S. J Interferon Cytokine Res. 1996;16:395–402. - PubMed

Publication types

MeSH terms

LinkOut - more resources