. 2001 May 1;21(9):3161-74.
doi: 10.1523/JNEUROSCI.21-09-03161.2001.

Adaptive axonal remodeling in the midbrain auditory space map

Affiliations

Adaptive axonal remodeling in the midbrain auditory space map

W M DeBello et al. J Neurosci. .

Abstract

The auditory space map in the external nucleus of the inferior colliculus (ICX) of barn owls is highly plastic, especially during early life. When juvenile owls are reared with prismatic spectacles (prisms) that displace the visual field laterally, the auditory spatial tuning of neurons in the ICX adjusts adaptively to match the visual displacement. In the present study, we show that this functional plasticity is accompanied by axonal remodeling. The ICX receives auditory input from the central nucleus of the inferior colliculus (ICC) via topographic axonal projections. We used the anterograde tracer biocytin to study experience-dependent changes in the spatial pattern of axons projecting from the ICC to the ICX. The projection fields in normal adults were sparser and more restricted than those in normal juveniles. The projection fields in prism-reared adults were denser and broader than those in normal adults and contained substantially more bouton-laden axons that were appropriately positioned in the ICX to convey adaptive auditory spatial information. Quantitative comparison of results from juvenile and prism-reared owls indicated that prism experience led to topographically appropriate axonal sprouting and synaptogenesis. We conclude that this elaboration of axons represents the formation of an adaptive neuronal circuit. The density of axons and boutons in the normal projection zone was preserved in prism-reared owls. The coexistence of two different circuits encoding alternative maps of space may underlie the ability of prism-reared owls to readapt to normal conditions as adults.


Figures

Fig. 1.
Fig. 1.
The midbrain sound localization pathway.A, Ascending ITD information is represented in frequency-specific channels within the ICC. It is relayed from the ICC to the ICX where it is combined across frequency channels and with other auditory cues to form a map of auditory space. This map is relayed to the OT where it merges with a visual space map derived from retinal input and input from the forebrain. B, Lateral view of a barn owl brain showing the horizontal plane of section through the midbrain. C, Hypothesis for adaptive axonal remodeling in the midbrain auditory space map. These are horizontal sections through the right optic lobe in a normal (left panel) and prism-reared (right panel) owl. The ITD tuning of neurons is indicated bynumbers in the ICC and OT: i20 indicates ipsilateral-leading 20 μsec (i.e., right-ear leading on the right side of the brain), and c20 indicates contralateral-leading 20 μsec. In all structures, ipsilateral-leading ITDs are represented rostrally, and contralateral-leading ITDs are represented progressively more caudally. Iso-ITD contours are indicated by thin lines. Spatially restricted axonal projections from the ICC to the ICX are indicated by thick arrows; spatially restricted axonal projections from the ICX to the OT are not shown. Normally, a sound producing an ITD of c20 μsec originates at contralateral 8° in the owl's visual field. During prism rearing, owls experience a chronic displacement of the visual field, as indicated by the dashed lines in the right panel. For instance, a visual stimulus at c8° activates neurons at an abnormally rostral location in the OT, one that normally responds optimally to an ITD of i20 μsec. After several weeks of prism experience, however, this location responds optimally to an ITD of ∼c20 μsec. A comparable shift in ITD tuning also occurs in the ICX, but no shift occurs in the ICC, suggesting that the ICC–ICX axonal projection is adaptively remodeled (thick arrows, right panel).
Fig. 2.
Fig. 2.
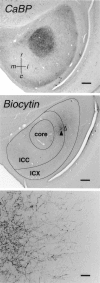
Visualization of the ICC–ICX axonal projection field. Top, Horizontal midbrain section reacted with an antibody to CaBP, which stains the core subdivision of the ICC. Scale bar, 500 μm. Middle, Neighboring horizontal section reacted for biocytin, the anterograde tracer. Overlaid is a sketch of the CaBP section showing the relevant anatomical boundaries. The border between the ICC and the ICX was defined as 600 μm from the lateral edge of the core region. At this resolution (2× objective), the injection site is clearly visible (solid arrowhead), but the labeled ICX axons (empty arrowhead; seebottom panel) are not. Scale bar, 500 μm.Bottom, Labeled axons in the ICX (10× objective). Numerous, branched, bouton-laden axons extend from the injection site into the ICX, where they terminate. For each case, the entire projection field in the ICX was traced and reconstructed. Scale bar, 100 μm.
Fig. 3.
Fig. 3.
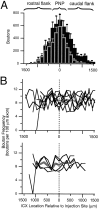
Quantification of the axonal projection fields. Left, Sketch of all labeled axons in the ICX from a single section containing the injection site. To quantify the length of labeled axons, the ICX was divided into zones measuring 160 μm in rostral-caudal extent (∼5% of the total rostral-caudal extent of ICX) and oriented orthogonally to the rostral-caudal axis. Measurement zones are shown asrectangles. Right, Histogram of the spatial distibutions of axonal labeling. Histograms represent the total labeling across all sections for the given case. The dotted line indicates the rostral-caudal level of the injection site. The numbers along the abscissa represent the distance in micrometers from this level, measured along the rostral-caudal axis. The values along the ordinate indicate the amount of labeling contained within each measurement zone. Data are presented in two different ways. First, values in each measurement zone were normalized to the maximum value observed for the case, reflecting the spatial pattern of the projection field (i.e., top axis). Normalized axonal labeling is presented with solid lines. Second, raw values were used that reflect both the pattern and extent of the projection (i.e., bottom axis). Raw axonal labeling is presented withbars.
Fig. 4.
Fig. 4.
The ICC–ICX projection field in normal juveniles. Left, Sketch of labeled axons from the ICX in a single section containing the injection site in a representative, normal juvenile owl. Right, Spatial pattern of projection in all seven juvenile cases. The case shown on theleft is indicated in bold. These data represent the total labeling across all sections for any given case, and therefore the bold trace does not match exactly the sketch shown on the left. In all cases, the projection field was spatially restricted, centered near the rostral-caudal level of the injection site, and symmetrical.
Fig. 5.
Fig. 5.
The ICC–ICX projection field in normal adults. Left, Sketch of labeled axons from the ICX in a single section containing the injection site in a representative normal adult owl. Right, Spatial pattern of the projection in all five adult cases. The case shown on the left is indicated in bold. These data represent the total labeling across all sections for any given case, and therefore thebold trace does not match exactly the sketch shown on the left. In all cases, the projection field was spatially restricted, centered near the rostral-caudal level of the injection site, and asymmetrical with a rostral skew.
Fig. 6.
Fig. 6.
Comparison of normal juvenile with normal adult axonal projection fields. A, Composite spatial pattern for normal juveniles (black line) and normal adults (gray line). These were obtained by averaging the individual cases shown in Figures 4 and 5, respectively. The error bars (SEM) reflect case-to-case variation. B, Composite spatial distributions of total axonal labeling. These histograms reflect both the spatial pattern and the extent of the projection fields. The different subregions of the projection fields are indicated by brackets above the data. The peak of the normal projection (PNP) was defined as the measurement zone that contained the greatest amount of axonal labeling and the measurement zones on either side. The rostral and caudal flanks were defined as all locations rostral to and caudal to, respectively, the PNP. Direct inspection reveals that during normal development, there is a net elimination of axons predominantly from the caudal flank of the projection field.
Fig. 7.
Fig. 7.
Spatial distributions of boutons and bouton frequency in normal juvenile and normal adult owls. A, Composite spatial distributions of boutons for normal juveniles (black bars) and normal adults (gray bars). These were obtained in an analogous manner as those for axonal labeling (Fig. 6). The error bars indicate SEM.B, Bouton frequency plots for all juvenile (top) and four of the five adult cases (bottom). Boutons were not counted in the one adult case in which BDA was used as the anterograde tracer. Bouton frequency was defined as the number of boutons per 100 μm axon. The bold gray trace indicates the average of the individual cases. There were no statistical differences between any two subregions in either group.
Fig. 8.
Fig. 8.
A, The axonal remodeling hypothesis. The static representation of ITD in the ICC is indicated in microseconds. Experience with right-shifting prisms causes the acquisition of responses to more left-ear-leading ITDs in the ICX on both sides of the brain. On the left side, left-ear-leading ITDs are represented rostrally in the ICC, and therefore the hypothesis predicts a caudal skew of the ICC–ICX axonal projection pattern. On the right side, left-ear-leading ITDs are represented caudally, and the hypothesis predicts a rostral skew. B, Sketches of labeled axons in the ICX from single sections containing the injection site for a caudalward map shift (left panel) and a rostralward map shift (right panel). Map shifts were measured physiologically. In both cases, there was an expansion, compared with normal adults, of axonal labeling in the adaptive direction.
Fig. 9.
Fig. 9.
ICC–ICX projection fields in prism-reared owls (thick black lines). The normal adult composite pattern is shown in gray for comparison. In all four cases with a rostralward map shift, the projection pattern is skewed rostrally, and in all three cases with a caudalward map shift, the projection is skewed caudally.
Fig. 10.
Fig. 10.
Spatial distributions of total axonal labeling in prism-reared owls (black bars) and normal owls (gray bars). The error bars indicate SEM. A, Rostralward (left) and caudalward (right) map shifts versus normal adults.B, Rostralward (left) and caudalward (right) map shifts versus normal juveniles. All axes and labels are as in Figure 6B.
Fig. 11.
Fig. 11.
Bouton-laden axons in the ICX (40× objective). Representative axons located at the peak of the normal projection in a prism-reared owl with a rostralward map shift (left panel), the rostral flank in the same owl (middle panel), and the rostral flank of a normal juvenile (right panel). Scale bar, 20 μm.
Fig. 12.
Fig. 12.
Top panels, Spatial distributions of boutons for prism-reared owls (black bars) and normal juveniles (gray bars). The error bars indicate SEM. Bottom panels, Bouton frequency plots for rostralward (left) and caudalward (right) map shifts. The bold gray tracesindicate the averages of the individual cases.
Fig. 13.
Fig. 13.
Probability distributions of bouton frequency. The bars indicate the number of 100-μm-long axonal segments with the given bouton frequency. Measurements were made on the rostral flank in normal juvenile and in prism-reared owls with rostralward map shifts. One hundred individual axon segments were examined in each group.
Fig. 14.
Fig. 14.
ICC–ICX projection pattern in an owl with prism experience but no physiological map shift. The normal adult composite is shown in gray.
Fig. 15.
Fig. 15.
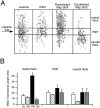
A, Representative axonal sketches of sections from normal juvenile, normal adult, and prism-reared owls with rostralward and caudalward map shifts. The rostrocaudal level of the injection site is indicated on the left.B, Mean total axonal labeling at each subregion of the ICC–ICX projection field in all four experimental groups: normal juveniles (open bars), normal adults (diagonal hatching), rostralward map shifts (solid black), and caudalward map shifts (checkerboard).
Fig. 16.
Fig. 16.
Schematic summary of adaptive axonal remodeling. The axons representing c20 μsec are shown in bold. The normal juvenile projection (top left), representing the initial state of the projection, is broad and symmetrical. During normal development, there is a net elimination of axons and boutons predominantly from the caudal flank of the projection, resulting in an adult projection (top right) that is narrower and asymmetrical. Prism experience alters the net balance between axon elaboration and elimination. For rostralward map shifts (bottom left), remodeling occurs by a net elaboration of axons that is largely restricted to the rostral flank of the projection. For caudalward map shifts, remodeling occurs by a net elimination of axons on the rostral flank and a net preservation of axons on the caudal flank.

References

    1. Antonini A, Stryker MP. Rapid remodeling of axonal arbors in the visual cortex. Science. 1993;260:1819–1821. - PubMed
    1. Antonini A, Stryker MP. Plasticity of geniculocortical afferents after brief or prolonged monocular occlusion in the cat. J Comp Neurol. 1996;369:64–82. - PubMed
    1. Antonini A, Stryker MP. Effect of sensory disuse on geniculate afferents to cat visual cortex. Vis Neurosci. 1998;15:401–409. - PMC - PubMed
    1. Brainard MS, Knudsen EI. Experience-dependent plasticity in the inferior colliculus: a site for visual calibration of the neural representation of auditory space in the barn owl. J Neurosci. 1993;13:4589–4608. - PMC - PubMed
    1. Brickley SG, Keating MJ, Grant S. Experience-dependent mechanism of binocular map plasticity in Xenopus: incongruent connections are masked by retinal input. Neurosci Lett. 1994;182:13–16. - PubMed

Publication types

MeSH terms

LinkOut - more resources