. 2001 May;64(5):1320-30.
doi: 10.1095/biolreprod64.5.1320.

Kinesin light-chain KLC3 expression in testis is restricted to spermatids

Affiliations

Kinesin light-chain KLC3 expression in testis is restricted to spermatids

A Junco et al. Biol Reprod. 2001 May.

Abstract

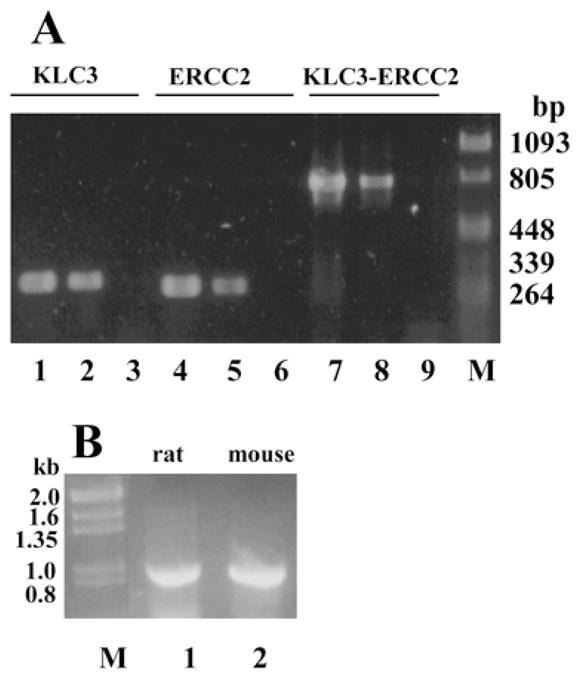
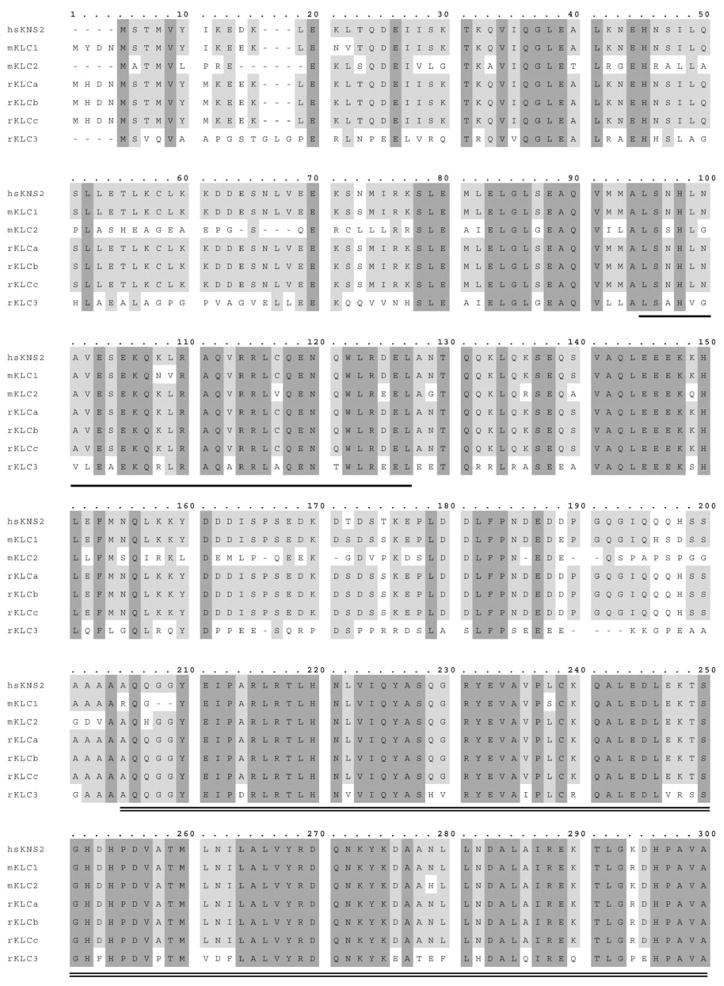
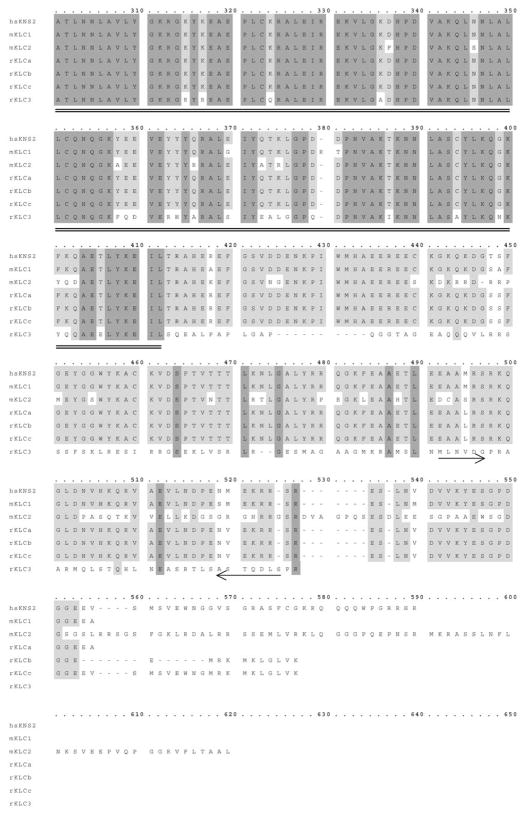
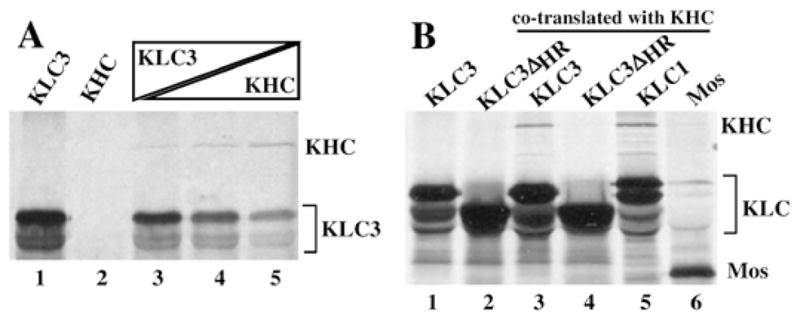
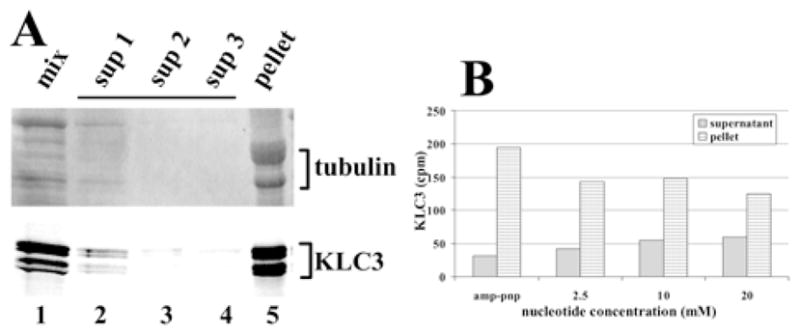
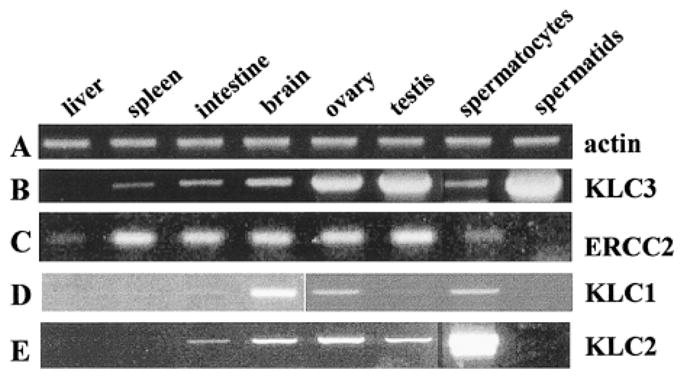
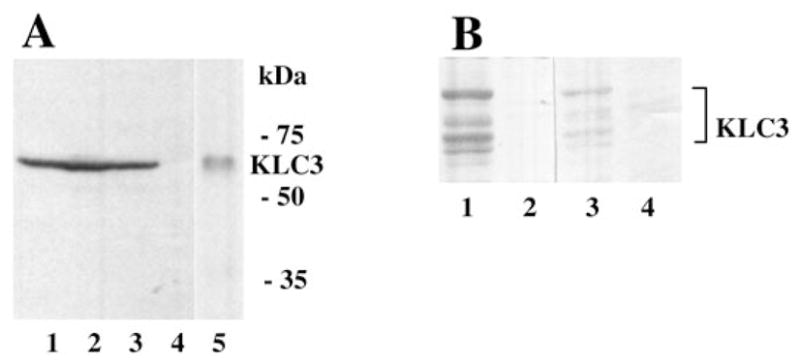
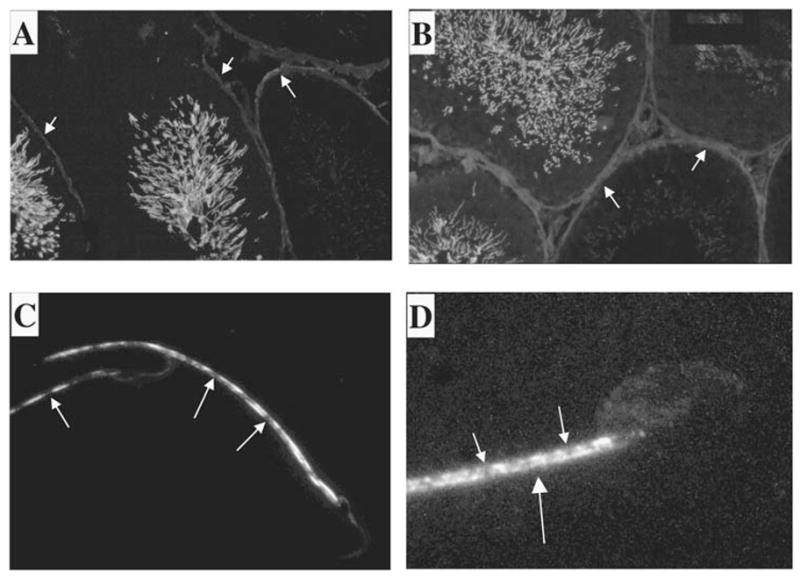
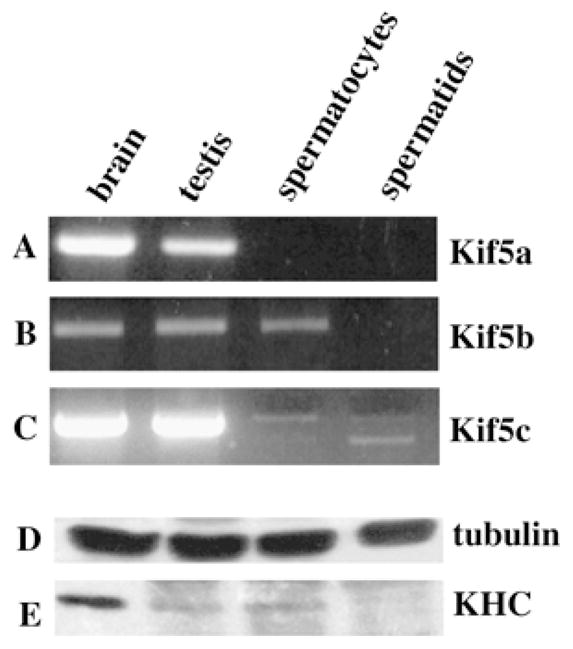
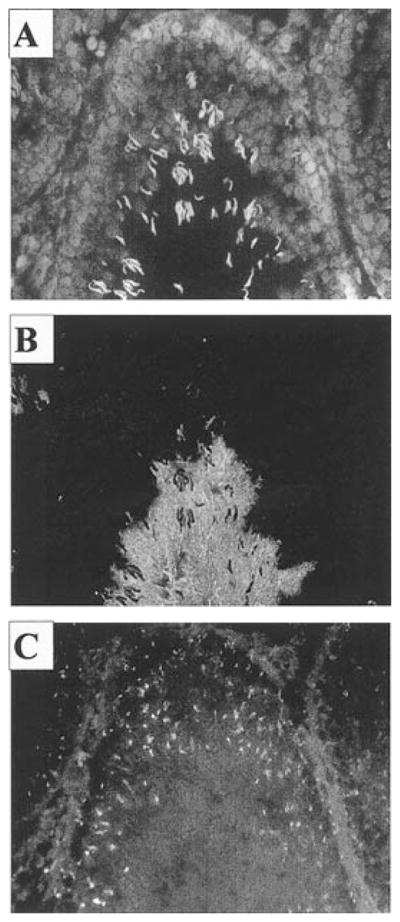
Kinesins are tetrameric motor molecules, consisting of two kinesin heavy chains (KHCs) and two kinesin light chains (KLCs) that are involved in transport of cargo along microtubules. The function of the light chain may be in cargo binding and regulation of kinesin activity. In the mouse, two KLC genes, KLC1 and KLC2, had been identified. KLC1 plays a role in neuronal transport, and KLC2 appears to be more widely expressed. We report the cloning from a testicular cDNA expression library of a mammalian light chain, KLC3. The KLC3 gene is located in close proximity to the ERCC2 gene. KLC3 can be classified as a genuine light chain: it interacts in vitro with the KHC, the interaction is mediated by a conserved heptad repeat sequence, and it associates in vitro with microtubules. In mouse and rat testis, KLC3 protein expression is restricted to round and elongating spermatids, and KLC3 is present in sperm tails. In contrast, KLC1 and KLC2 can only be detected before meiosis in testis. Interestingly, the expression profiles of the three known KHCs and KLC3 differ significantly: Kif5a and Kif5b are not expressed after meiosis, and Kif5c is expressed at an extremely low level in spermatids but is not detectable in sperm tails. Our characterization of the KLC3 gene suggests that it carries out a unique and specialized role in spermatids.


Figures

FIG. 1
FIG. 1
KLC3 and ERCC2 are in close proximity. A) To establish that KLC3 and ERCC2 genes are in close proximity in the genome, PCR was employed to detect the two gene sequences in a genomic KLC3 clone (lanes 1, 4, and 7) and in high molecular weight genomic DNA (lanes 2, 5, and 8). Controls lacking DNA were also included (lanes 3, 6, and 9). For reactions in lanes 1–3, KLC3-specific primers were used (predicted product size, 300 bp). For reactions in lanes 4–6, ERCC2-specific primers were used (predicted product size, 274 bp). For reactions in lanes 7–9, primers specific for both genes, such that they span the intragenic region, were employed (predicted product size, 813 bp). B) Rat and mouse genomic DNA was compared by PCR to determine if ERCC2 and KLC3 are in close proximity in rat (lane 1), as they are in mouse (lane 2). High molecular weight genomic DNA was used as a template using primers spanning ERCC2 and KLC3 sequences as described in A. Both samples generate a product identical in size (813 bp). M, Lambda and pBluescript molecular weight markers.
FIG. 2
FIG. 2
Sequence comparison of KLC3 with mammalian KLC by alignment of the reported mammalian KLC proteins with KLC3. Residues that are conserved in all species are shaded in dark gray. Residues conserved in several species are shaded in light gray. Hyphens indicate differences. The conserved HR region is underlined, and the TPR sequences are double-underlined. The location of primers used in PCR are indicated with arrows.
FIG. 2
FIG. 2
Sequence comparison of KLC3 with mammalian KLC by alignment of the reported mammalian KLC proteins with KLC3. Residues that are conserved in all species are shaded in dark gray. Residues conserved in several species are shaded in light gray. Hyphens indicate differences. The conserved HR region is underlined, and the TPR sequences are double-underlined. The location of primers used in PCR are indicated with arrows.
FIG. 3
FIG. 3
Interaction of KLC3 with KHC. A) To analyze KLC3 interaction with KHC, immunoprecipitations of HA-tagged KLC3 and Kif5c were conducted using anti-HA antibodies. Both proteins were in vitro transcribed and translated individually (lanes 1 and 2, respectively) or together at different ratios (lanes 3–5, increasing ratio of KHC vs. KLC3). Immunoprecipitated proteins were resolved by SDS-PAGE followed by autoradiography; KHC and KLC are indicated. B) The HR region of KLC3 was deleted, and the resulting construct, HA-tagged KLC3-ΔHR, was used in experiments similar to those described in A. The mobility of the KLC3-ΔHR mutant (lane 2) is higher than that of KLC3 (lane 1), as expected. KLC3, KLC3-ΔHR, KLC1 (positive control for association with KHC), and Mos (negative control for association with KHC) were expressed as fusion proteins with an HA-tag and co-translated with Kif5c (lanes 3–6, respectively). Complexes were immunoprecipitated with anti-HA antibodies and analyzed by SDS-PAGE.
FIG. 4
FIG. 4
MT binding of KLC3. A) In vitro-translated, radiolabeled KLC3 was incubated with purified, taxol-stabilized MTs and pelleted. The MT pellets were washed and repelleted twice more, after which the pellet and the three supernatants were examined for tubulin (upper panel, coomassie-stained region of the gel) and KLC3 (lower panel, autoradiogram). Lane 1: aliquots of reaction mixture of translation mix and MT (mix); lanes 2–4: aliquots of supernatants from the first, second, and third pelleting reaction (sup1–sup3); lane 5: final pellet (pellet). Tubulin and KLC3 are indicated. B) To analyze ATP-dependency of the KLC3-MT association, the above protocol was repeated in the presence of either AMP-PNP or indicated amounts of ATP. Aliquots of the supernatant and the entire pellet were analyzed by SDS-PAGE. KLC3-containing gel slices were identified by autoradiography, excised from the gel, and counted. The amount recovered is shown. Supplanting AMP-PNP with ATP resulted in a shift of KLC3 from the MT pellet to the supernatant.
FIG. 5
FIG. 5
In testis, KLC3 is predominantly expressed in spermatids. Gene expression was analyzed by RT-PCR, and total RNA was isolated from indicated tissues and elutriated male germ cells, quantified, and standardized. The cDNA was produced by random priming and amplified with primers specific for the indicated genes. Lane A: β-actin (positive control for the procedures); lane B: KLC3 (note the widespread distribution of KLC3 in various tissues, with highest KLC3 RNA expression in spermatids); lane C: ERCC2; lane D: KLC1; lane E: KLC2.
FIG. 6
FIG. 6
KLC3 protein expression. A) To confirm the KLC3 mRNA expression pattern in male germ cells and determine its apparent size, Western blot analysis was carried out using extracts from elongating spermatids, a mix of elongating spermatids and round spermatids, round spermatids, and pachytene spermatocytes (lanes 1–4, respectively) and epididymal spermatozoa (lane 5). KLC3 expression was probed using polyclonal antibodies. B) Monoclonal antibodies were raised against KLC3 for immunofluorescence studies. Specificities of the mAbs were analyzed by Western blots. Extracts from cells transfected with an HA-tagged KLC3 (lanes 1 and 3) or an unrelated control construct (lanes 2 and 4) were resolved by SDS-PAGE, transferred to membranes, and probed with anti-HA specific mAb (lanes 1 and 2) and anti-KLC3 mAb (lanes 3 and 4). Anti-KLC3 mAb specifically recognizes KLC3.
FIG. 7
FIG. 7
KLC3 localization in testis. The expression pattern of KLC3 protein in seminiferous tubules was examined by immunofluorescence using the mAb raised against KLC3. Frozen rat testicular sections were analyzed using anti-KLC3 mAb (A and B). Tails of KLC3-positive cells can be seen protruding into the lumen. A detailed image of KLC3 in sperm tails was obtained by deconvolution confocal microscopy of rat and mouse epididymal spermatozoa using anti-KLC3 mAb (C and D, respectively). Note that only the midpiece shows KLC3 staining, and that this pattern is not homogenous. Original magnification ×20 (A and B) and ×100 (C and D).
FIG. 8
FIG. 8
Expression pattern of the three known KHC genes in mouse testis. The KHC gene expression in brain, testis, spermatocytes, and spermatids (as indicated) was carried out as described previously by RT-PCR. Primer pairs were specific for Kif5a, Kif5b, and Kif5c (AC, respectively). Note the absence of Kif5a in male germ cells and of Kif5b in spermatids. Kif5c is expressed at very low levels in spermatids. Western blot analysis of KHC expression in brain, testis, spermatocytes, and spermatids, as indicated. Samples and procedures were standardized for protein content, as indicated by the similar amount of tubulin in the various samples using anti-tubulin antisera (D). The expression of KHC was analyzed using H1 and H2 mAbs, which recognize Kif5b and Kif5c (E). This procedure cannot discriminate between the two proteins, which differ by only 1 kDa. Note the very low level of expression in spermatids.
FIG. 9
FIG. 9
KHC is not detectable in sperm tails. The expression profile of KHC genes in seminiferous tubules was analyzed by immunofluorescence of rat frozen testicular sections using three different KHC-specific antibodies. All gave identical results. A) DAPI stain of nuclear DNA. B) Odf-2 staining of sperm tails using polyclonal anti-Odf2 antiserum. C) KHC staining using monoclonal anti-KHC antibodies. Note the punctuate pattern of KHC expression, and the absence of KHC staining in sperm tails. Original magnification ×20.

References

    1. Bloom GS, Endow SA. Motor proteins. 1: kinesins. Protein Profile. 1994;1:1059–1116. - PubMed
    1. Cyr JL, Pfister KK, Bloom GS, Slaughter CA, Brady ST. Molecular genetics of kinesin light chains: generation of isoforms by alternative splicing. Proc Natl Acad Sci U S A. 1991;88:10114–10118. - PMC - PubMed
    1. Beushausen S, Kladakis A, Jaffe H. Kinesin light chains: identification and characterization of a family of proteins from the optic lobe of the squid Loligo pealii. DNA Cell Biol. 1993;12:901–909. - PubMed
    1. Cabeza-Arvelaiz Y, Shih LC, Hardman N, Asselbergs F, Bilbe G, Schmitz A, White B, Siciliano MJ, Lachman LB. Cloning and genetic characterization of the human kinesin light-chain (KLC) gene. DNA Cell Biol. 1993;12:881–892. - PubMed
    1. Fan J, Amos LA. Kinesin light chain isoforms in Caenorhabditis elegans. J Mol Biol. 1994;240:507–512. - PubMed

Publication types

MeSH terms