. 2001 Apr 24;98(9):4855-9.
doi: 10.1073/pnas.081070998.

Pitch perception: a dynamical-systems perspective

Affiliations

Pitch perception: a dynamical-systems perspective

J H Cartwright et al. Proc Natl Acad Sci U S A. .

Abstract

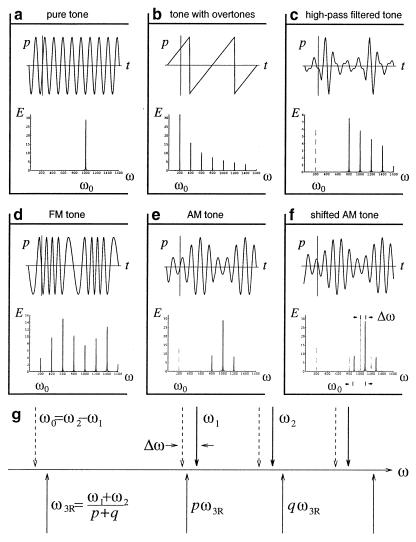
Two and a half millennia ago Pythagoras initiated the scientific study of the pitch of sounds; yet our understanding of the mechanisms of pitch perception remains incomplete. Physical models of pitch perception try to explain from elementary principles why certain physical characteristics of the stimulus lead to particular pitch sensations. There are two broad categories of pitch-perception models: place or spectral models consider that pitch is mainly related to the Fourier spectrum of the stimulus, whereas for periodicity or temporal models its characteristics in the time domain are more important. Current models from either class are usually computationally intensive, implementing a series of steps more or less supported by auditory physiology. However, the brain has to analyze and react in real time to an enormous amount of information from the ear and other senses. How is all this information efficiently represented and processed in the nervous system? A proposal of nonlinear and complex systems research is that dynamical attractors may form the basis of neural information processing. Because the auditory system is a complex and highly nonlinear dynamical system, it is natural to suppose that dynamical attractors may carry perceptual and functional meaning. Here we show that this idea, scarcely developed in current pitch models, can be successfully applied to pitch perception.


Figures

Figure 1
Figure 1
Stimuli: waveforms, Fourier spectra, and pitches. (a) A 1-kHz pure tone; the pitch coincides with the frequency ω0. (b) Complex tone formed by 200-Hz fundamental plus overtones; the pitch is at the frequency of the fundamental ω0. (c) After high-pass filtering of the previous tone to remove the fundamental and the first few overtones, the pitch ω0 remains at the frequency of the missing fundamental (dotted). (d) The result of frequency modulation of a 1 kHz pure tone carrier by a 200-Hz pure tone modulant. (e) Complex tone produced by amplitude modulation of a 1-kHz pure tone carrier by a 200-Hz pure tone modulant; the pitch coincides with the difference combination tone ω0. (f) The result of shifting the partials of the previous tone in frequency by Δω = 90 Hz; the pitch shifts by Δω0 ≈ 20 Hz, although the difference combination tone does not. (g) Schematic diagram of the frequency line details (above the line) the pitch shift behavior of f and (below the line) the three-frequency resonance we propose to explain it.
Figure 2
Figure 2
Experimental data (red dots) from Gerson and Goldstein (14) and from Schouten et al. (8) (1200–2200 Hz range) show pitch as a function of the lower frequency f = kω0 + Δω of a complex tone {kω0 + Δω, (k + 1)ω0 + Δω, (k + 2)ω0 + Δω, . . .} with the partials spaced g = ω0 = 200 Hz apart. The data of Schouten et al. are for three-component tones monotically presented (all of the stimulus entering one ear), and those of Gerson and Goldstein for four-component tones dichotically presented (part of the stimulus entering one ear and the rest of the stimulus the other, controlateral, ear); the harmonic numbers of the partials present in the stimuli are shown beside the data. The pitch-shift effect we predict from three-frequency resonance, taking into account the dominance region, is shown superimposed on the data as solid lines given by the equations P = g + (fn g)/(n + 1/2) (primary lines), P = g/2 + (f − (n + 1/2)g)/(2n + 2) (secondary lines), and P = g/4 + (f − (n − 1/4)g)/(4n + 1) (tertiary line); the harmonic numbers of the partials used to calculate the pitch-shift lines are shown enclosed in red squares. For primary lines these harmonic numbers correspond to n and n + 1, for secondary lines to 2n + 1 and 2n + 3, and for the tertiary line to 4n + 1 and 4n + 5. A red circle, instead of a square, signifies that the component is not physically present in the stimulus, but corresponds to a combination tone. The Inset corresponds to the slopes of the data averaged over the distinct experimental values plotted as a function of harmonic number. The blue squares are the data of Gerson and Goldstein, the red squares are those of Schouten et al., and lastly, the blue circles are data of Patterson (15) for six- and twelve-component tones, which are averaged over different experimental situations that represent several thousand points. The black diamonds correspond to our theory and show that the data of Gerson and Goldstein and those of Patterson saturate for different values of k (the experimental conditions were different).
Figure 3
Figure 3
Two-frequency devil's staircase. The rotation number, the frequency ratio ρ = −p/r = ω2R/ω1, is plotted against the period of the external force.
Figure 4
Figure 4
Three-frequency devil's staircase. Contrary to the case of periodically driven systems, where plateaux represent periodic solutions, plateaux here represent quasiperiodic solutions (only the third frequency is represented in the ordinate). We have investigated these properties in three different systems: the quasiperiodic circle map, a system of coupled electronic oscillators, and a set of ordinary nonlinear differential equations, with the same qualitative results (23) that confirm the theoretical predictions (11).

References

    1. Yost W A. J Acoust Soc Am. 1996;100:511–518. - PubMed
    1. Bregman A S. Auditory Scene Analysis: The Perceptual Organization of Sound. Cambridge, MA: MIT Press; 1990.
    1. Hartmann W M. J Acoust Soc Am. 1996;100:3491–3502. - PubMed
    1. Roberts B, Bayley P J. J Exp Psychol. 1996;22:604–614. - PubMed
    1. Moore B C J. An Introduction to the Psychology of Hearing. New York: Academic; 1997.

Publication types

LinkOut - more resources