

Region and tissue differences of metabolites in normally aged brain using multislice 1H magnetic resonance spectroscopic imaging
- PMID: 11323817
- PMCID: PMC1851682
- DOI: 10.1002/mrm.1119
Region and tissue differences of metabolites in normally aged brain using multislice 1H magnetic resonance spectroscopic imaging
Abstract
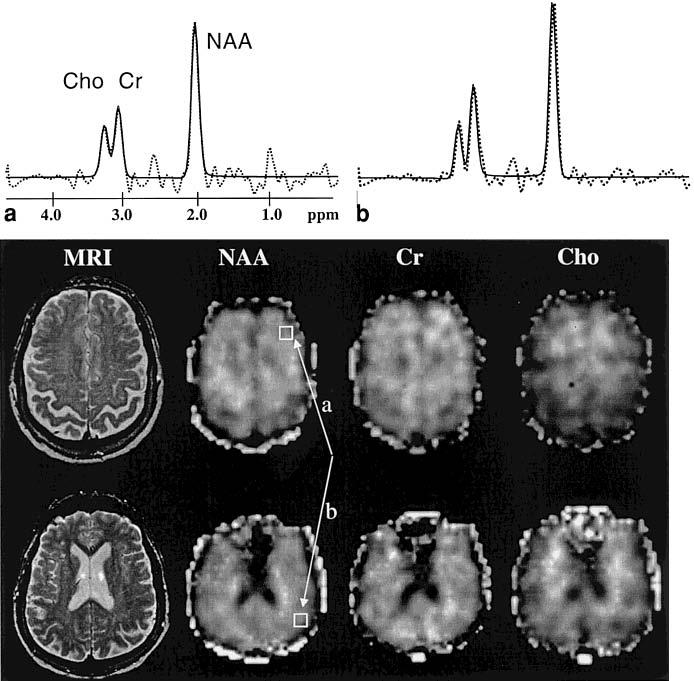
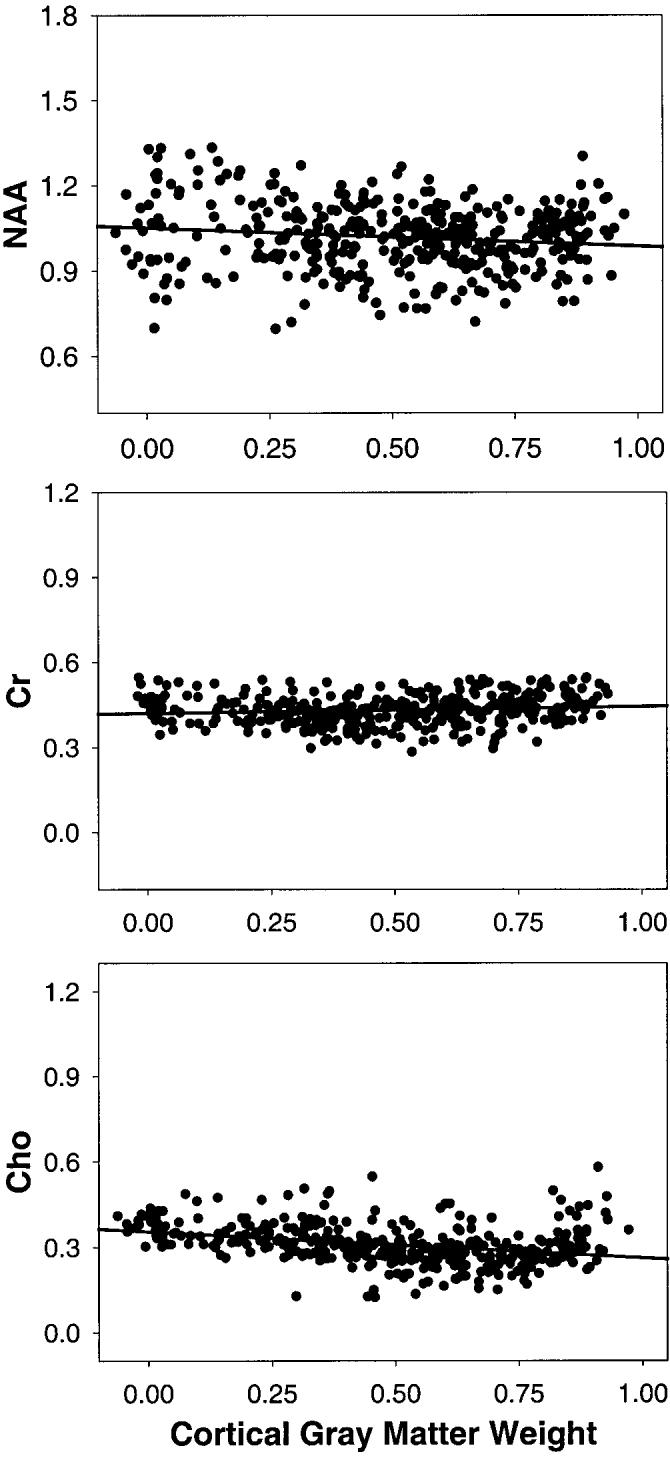
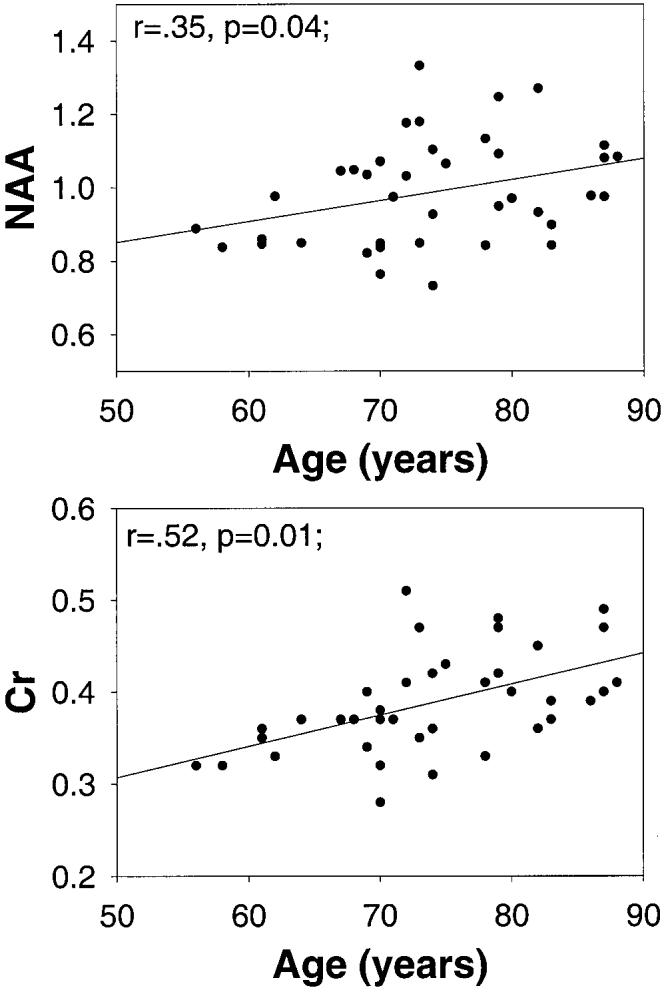
Quantitative measurements of regional and tissue specific concentrations of brain metabolites were measured in elderly subjects using multislice proton magnetic resonance spectroscopic imaging ((1)H MRSI). Selective k-space extrapolation and an inversion-recovery sequence were used to minimize lipid contamination and linear regression was used to account for partial volume problems. The technique was applied to measure the concentrations of N-acetyl aspartate (NAA), and creatine (Cr)- and choline (Cho)-containing compounds in cortical gray and white matter, and white matter lesions of the frontal and the parietal lobe in 40 normal elderly subjects (22 females and 18 males, 56-89 years old, mean age 74 +/- 8). NAA was about 15% lower in cortical gray matter and 23% lower in white matter lesions when compared to normal white matter. Cr was 11% higher in cortical gray matter than in white matter, and also about 15% higher in the parietal cortex than in the frontal cortex. Cho was 28% lower in cortical gray matter than in white matter. Furthermore, NAA and Cr changes correlated with age. In conclusion, regional and tissue differences of brain metabolites must be considered in addition to age-related changes when interpreting (1)H MRSI data.
Figures
References
-
- Bottomley PA. Spatial localization in NMR spectroscopy in vivo. Ann N Y Acad Sci. 1987;508:333–348. - PubMed
-
- Haase A, Frahm J. Multiple chemical-shift-selective NMR imaging using stimulated echoes. J Magn Reson. 1985;64:94–102.
-
- Duyn JH, Gillen J, Sobering G, van Zijl PC, Moonen CT. Multisection proton MR spectroscopic imaging of the brain. Radiology. 1993;188:277–282. - PubMed
-
- Hetherington HP, Pan JW, Mason GF, Adams D, Vaughn MJ, Twieg DB, Pohost GM. Quantitative 1H spectroscopic imaging of human brain at 4.1 T using image segmentation. Magn Reson Med. 1996;36:21–29. - PubMed
-
- Spielman D, Meyer C, Macovski A, Enzmann D. 1H spectroscopic imaging using a spectral-spatial excitation pulse. Magn Reson Med. 1991;18:269–279. - PubMed
MeSH terms
Substances
Grants and funding
LinkOut - more resources
Full Text Sources
Other Literature Sources
Medical
