Comparative Study
. 2001 May;39(5):1763-70.
doi: 10.1128/JCM.39.5.1763-1770.2001.

Classification and identification of enterococci: a comparative phenotypic, genotypic, and vibrational spectroscopic study

Affiliations
Comparative Study

Classification and identification of enterococci: a comparative phenotypic, genotypic, and vibrational spectroscopic study

C Kirschner et al. J Clin Microbiol. 2001 May.

Abstract

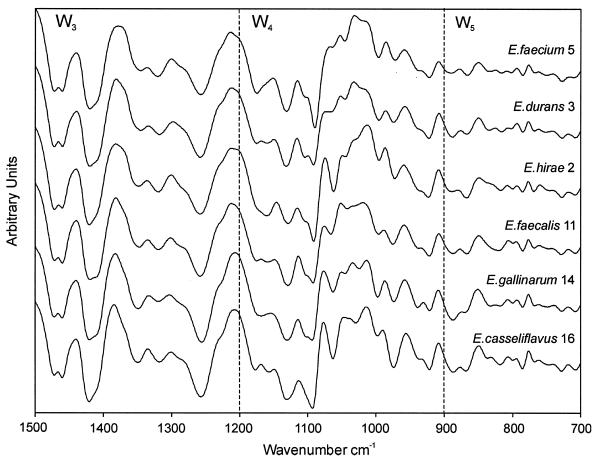
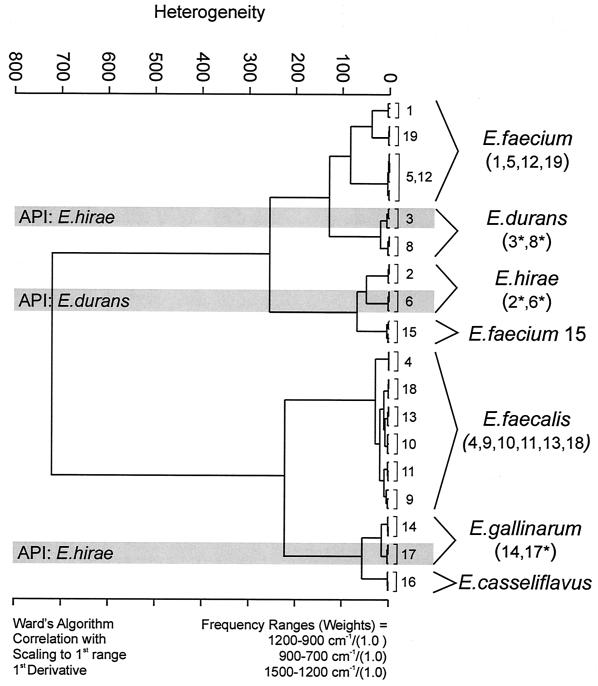
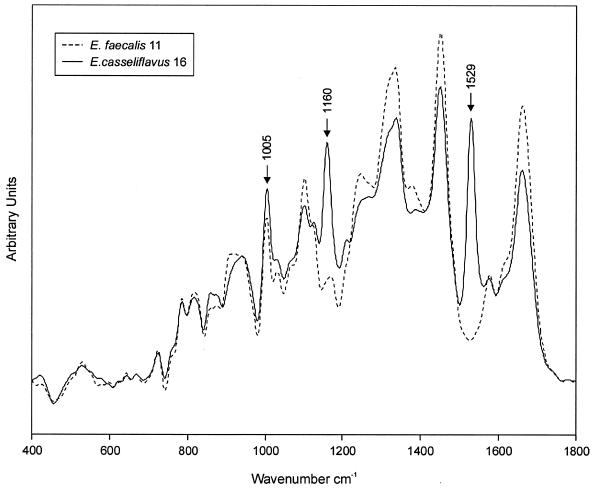
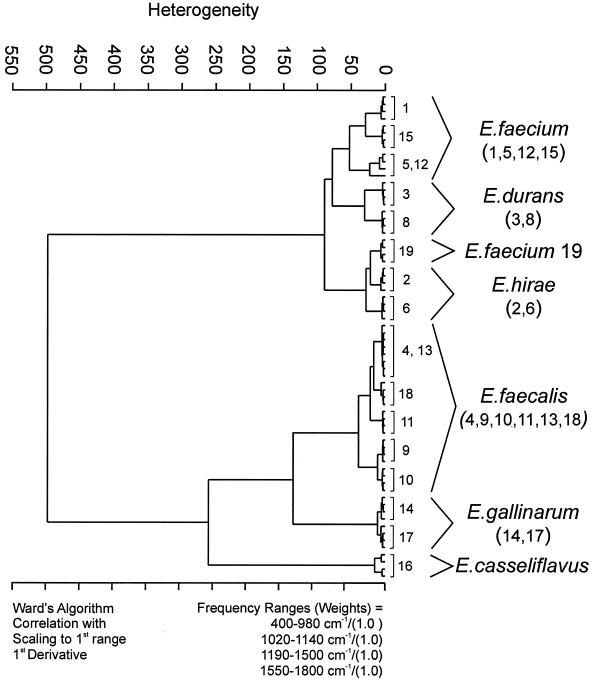
Rapid and accurate identification of enterococci at the species level is an essential task in clinical microbiology since these organisms have emerged as one of the leading causes of nosocomial infections worldwide. Vibrational spectroscopic techniques (infrared [IR] and Raman) could provide potential alternatives to conventional typing methods, because they are fast, easy to perform, and economical. We present a comparative study using phenotypic, genotypic, and vibrational spectroscopic techniques for typing a collection of 18 Enterococcus strains comprising six different species. Classification of the bacteria by Fourier transform (FT)-IR spectroscopy in combination with hierarchical cluster analysis revealed discrepancies for certain strains when compared with results obtained from automated phenotypic systems, such as API and MicroScan. Further diagnostic evaluation using genotypic methods-i.e., PCR of the species-specific ligase and glycopeptide resistance genes, which is limited to the identification of only four Enterococcus species and 16S RNA sequencing, the "gold standard" for identification of enterococci-confirmed the results obtained by the FT-IR classification. These results were later reproduced by three different laboratories, using confocal Raman microspectroscopy, FT-IR attenuated total reflectance spectroscopy, and FT-IR microspectroscopy, demonstrating the discriminative capacity and the reproducibility of the technique. It is concluded that vibrational spectroscopic techniques have great potential as routine methods in clinical microbiology.


Figures

FIG. 1
FIG. 1
Typical first-derivative IR spectra of the six different Enterococcus species depicted in the most-discriminatory spectral windows. The spectral windows are defined according to the classification of Helm et al. (10) as follows: W3, the window between 1,500 and 1,200 cm−1 (the mixed region), a spectral region containing information from proteins, fatty acids, and phosphate-carrying compounds; W4, the window between 1,200 and 900 cm−1 (the polysaccharide region), a spectral region dominated by the fingerprint-like absorption bands of the carbohydrates present within the cell wall; W5, the window between 900 and 700 cm−1 (the true fingerprint region), showing some remarkably specific spectral patterns, which are as yet unassigned to cellular components or to functional groups.
FIG. 2
FIG. 2
Classification scheme based on the FT-IR spectra of six different Enterococcus species. Cluster analysis of three repetitive measurements was performed using the first derivatives of the spectra, considering the spectral ranges from 1,200 to 900, 900 to 700, and 1,500 to 1,200 cm−1. All spectral ranges were equally weighted. Ward's algorithm was applied. The strains marked with an asterisk were not in accordance with the phenotypic identification by the API system. Shading highlights the identity of certain strains by the API system.
FIG. 3
FIG. 3
Raman spectra of E. casseliflavus strain 16 and E. faecalis strain 11 are depicted for spectral comparison. The Raman spectrum of the pigmented E. casseliflavus exhibits preresonance-enhanced bands of carotenoids. Three characteristic bands near 1005, 1155, and 1529 cm−1 are clearly visible.
FIG. 4
FIG. 4
Classification scheme based on the Raman spectra of six different Enterococcus species. Cluster analysis of four repetitive measurements was performed using the first derivatives of the spectra, considering the spectral ranges from 400 to 980, 1,020 to 1,140, 1,190 to 1500, and 1,500 to 1,800 cm−1, with the aim of excluding the spectral features that are caused by the carotenoid pigmentation of E. casseliflavus strain 16 and E. hirae strain 6. All spectral ranges were equally weighted. Ward's algorithm was applied.

References

    1. Bodnar U R, Noskin G A, Suriano T, Cooper I, Reisberg B E, Peterson L R. Use of in-house studies of molecular epidemology and full species identification for controlling spread of vancomycin-resistant Enterococcus faecalis isolates. J Clin Microbiol. 1996;34:2129–2132. - PMC - PubMed
    1. Bouhedja W, Sockalingum G D, Pina P, Allouch P, Bloy C, Labia R, Millot J M, Manfait M. ATR-FTIR spectroscopic investigation of E. coli transconjugants beta-lactams-resistance phenotype. FEBS Lett. 1997;412:39–42. - PubMed
    1. Bryce E A, Zemcov S J, Clarke A M. Species identification and antibiotic resistance patterns of the enterococci. Eur J Clin Microbiol Infect Dis. 1991;10:745–747. - PubMed
    1. Buschelman B J, Bale M J, Jones R N. Species identification and determination of high-level aminoglycoside resistance among enterococci. Comparison study of sterile body fluid isolates, 1985–1991. Diagn Microbiol Infect Dis. 1993;16:119–122. - PubMed
    1. Cheng S, McCleskey F-K, Gress M J, Petroziello J M, Liu R, Namdari H, Beninga K, Salmen A, DelVecchio V G. A PCR assay for identification of Enterococcus faecium. J Clin Microbiol. 1997;35:1248–1250. - PMC - PubMed

Publication types

LinkOut - more resources