

A new mathematical model for relative quantification in real-time RT-PCR
- PMID: 11328886
- PMCID: PMC55695
- DOI: 10.1093/nar/29.9.e45
A new mathematical model for relative quantification in real-time RT-PCR
Abstract
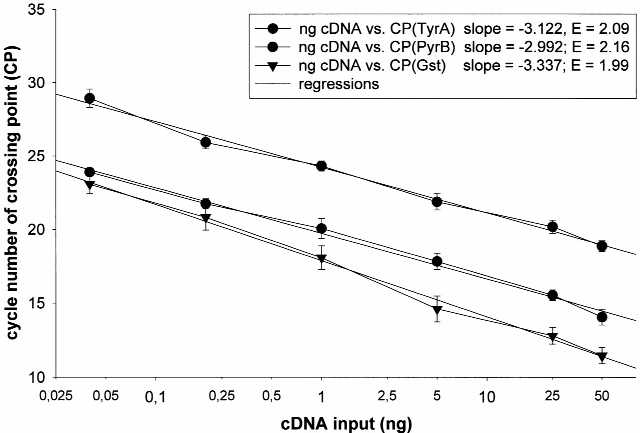
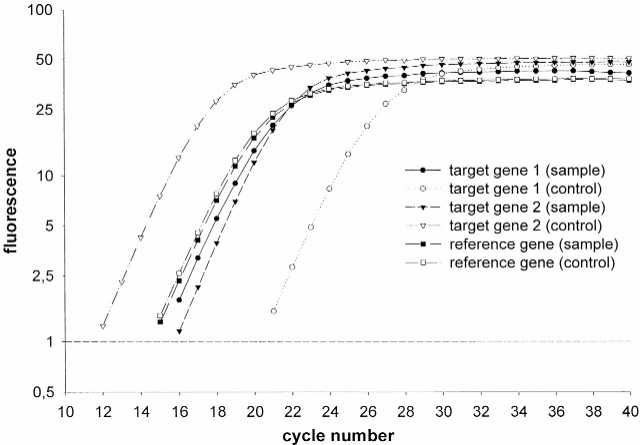
Use of the real-time polymerase chain reaction (PCR) to amplify cDNA products reverse transcribed from mRNA is on the way to becoming a routine tool in molecular biology to study low abundance gene expression. Real-time PCR is easy to perform, provides the necessary accuracy and produces reliable as well as rapid quantification results. But accurate quantification of nucleic acids requires a reproducible methodology and an adequate mathematical model for data analysis. This study enters into the particular topics of the relative quantification in real-time RT-PCR of a target gene transcript in comparison to a reference gene transcript. Therefore, a new mathematical model is presented. The relative expression ratio is calculated only from the real-time PCR efficiencies and the crossing point deviation of an unknown sample versus a control. This model needs no calibration curve. Control levels were included in the model to standardise each reaction run with respect to RNA integrity, sample loading and inter-PCR variations. High accuracy and reproducibility (<2.5% variation) were reached in LightCycler PCR using the established mathematical model.
Figures
References
-
- Morrison T., Weis,J.J. and Wittwer,C.T. (1998) Quantification of low-copy transcripts by continuous SYBR Green I monitoring during amplification. Biotechniques, 24, 954–962. - PubMed
-
- Freeman W.M., Walker,S.J. and Vrana,K.E. (1999) Quantitative RT–PCR: pitfalls and potential. Biotechniques, 26, 112–122. - PubMed
-
- Pfaffl M.W. (2001) Development and validation of an externally standardised quantitative insulin like growth factor-1 (IGF-1) RT–PCR using LightCycler SYBR® Green I technology. In Meuer,S., Wittwer,C. and Nakagawara,K. (eds), Rapid Cycle Real-time PCR, Methods and Applications. Springer Press, Heidelberg, Germany pp. 281–291.
-
- Ferré F. (1992) Quantitative or semi-quantitative PCR: reality versus myth. PCR Methods Appl., 2, 1–9. - PubMed
-
- Souazé ,F., Ntodou-Thomé,A., Tran,C.Y., Rostene,W. and Forgez,P. (1996) Quantitative RT–PCR: limits and accuracy. Biotechniques, 21, 280–285. - PubMed
Publication types
MeSH terms
Substances
LinkOut - more resources
Full Text Sources
Other Literature Sources
Medical
