. 2001 Apr 30;153(3):517-27.
doi: 10.1083/jcb.153.3.517.

Merotelic kinetochore orientation is a major mechanism of aneuploidy in mitotic mammalian tissue cells

Affiliations

Merotelic kinetochore orientation is a major mechanism of aneuploidy in mitotic mammalian tissue cells

D Cimini et al. J Cell Biol. .

Abstract

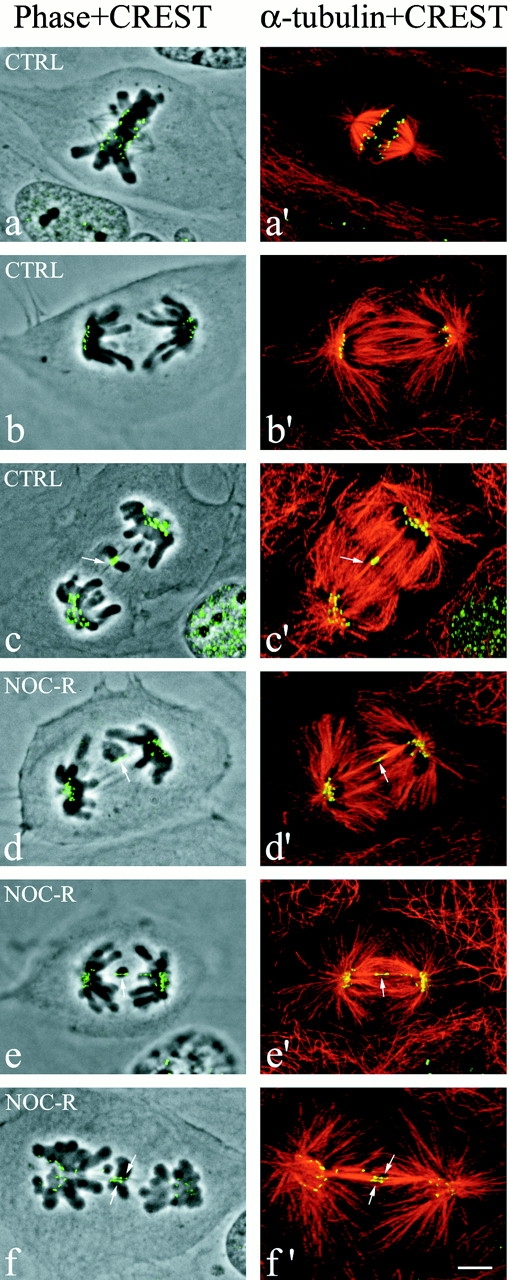
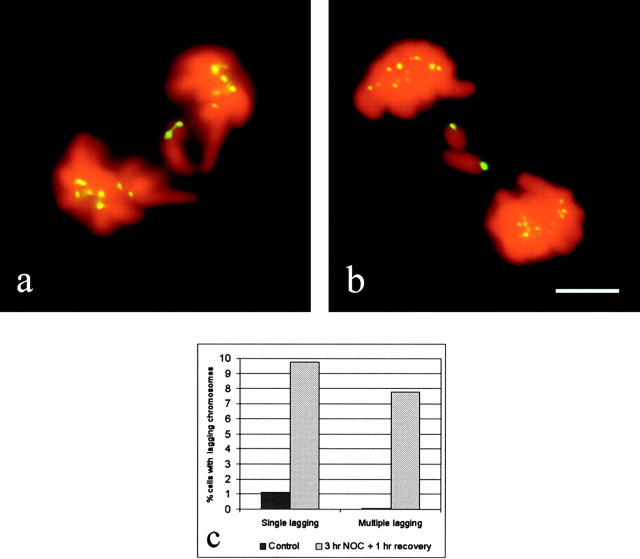
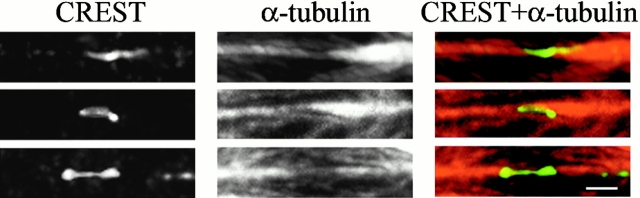
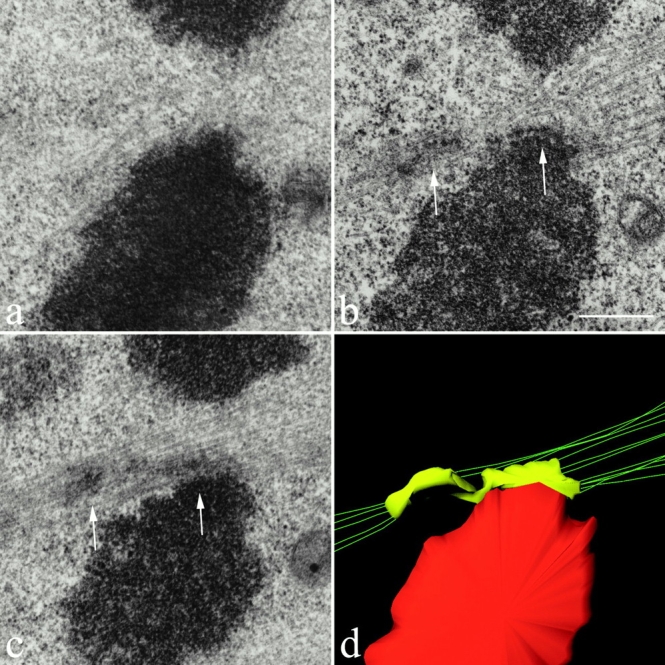
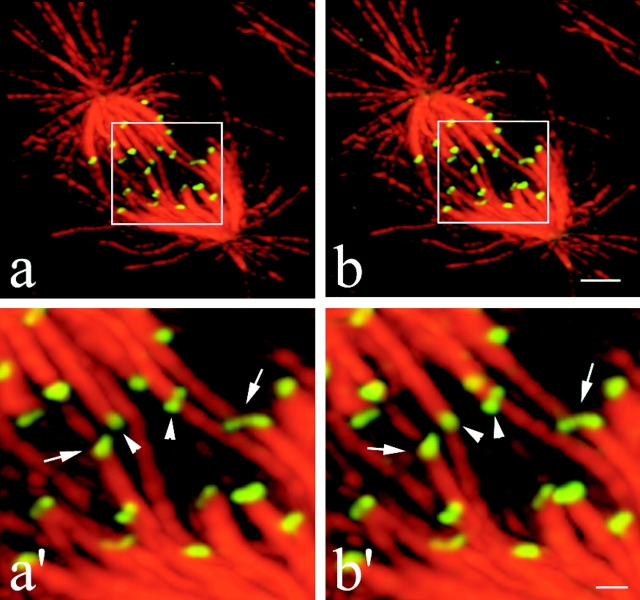
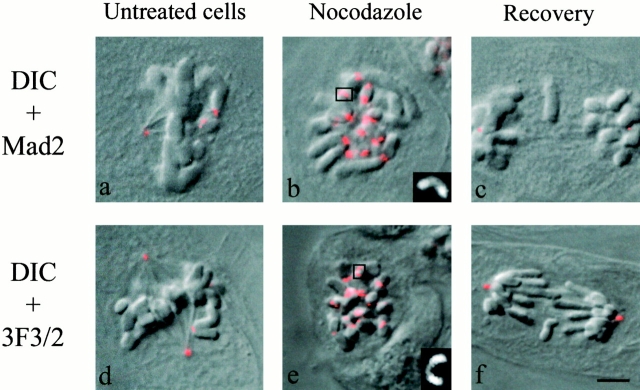
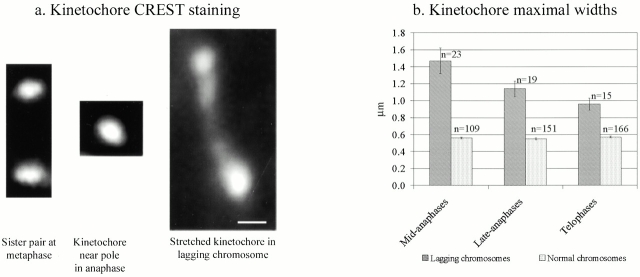
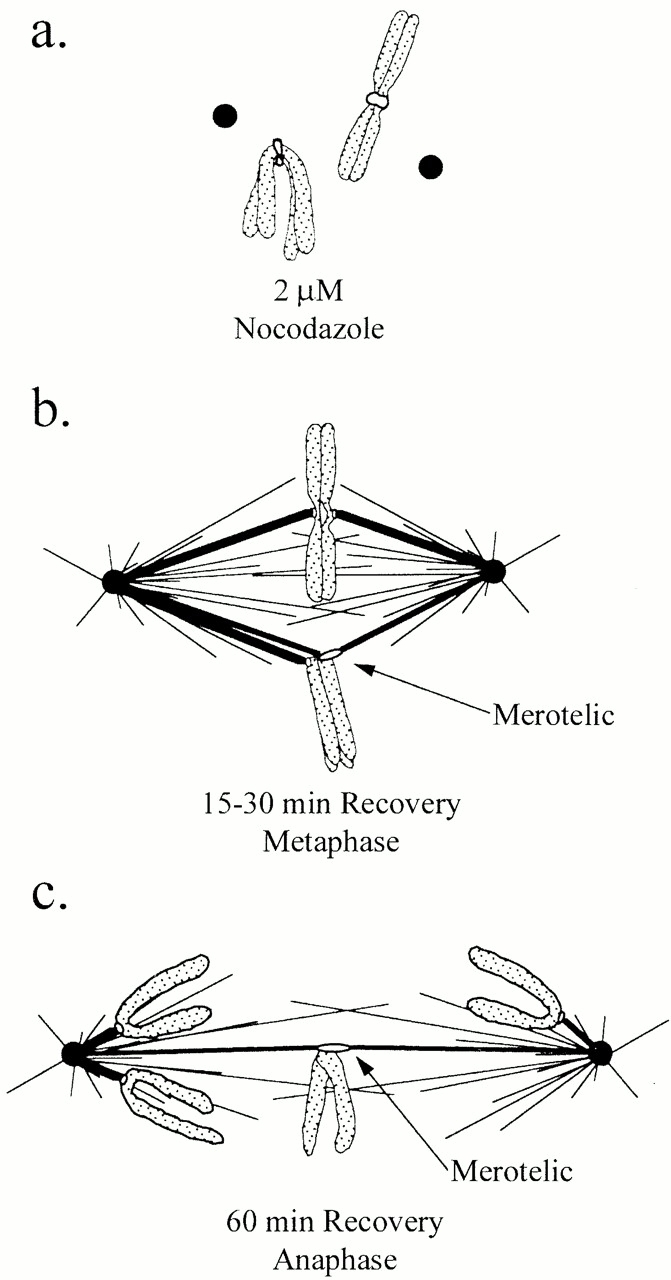
In mitotic cells, an error in chromosome segregation occurs when a chromosome is left near the spindle equator after anaphase onset (lagging chromosome). In PtK1 cells, we found 1.16% of untreated anaphase cells exhibiting lagging chromosomes at the spindle equator, and this percentage was enhanced to 17.55% after a mitotic block with 2 microM nocodazole. A lagging chromosome seen during anaphase in control or nocodazole-treated cells was found by confocal immunofluorescence microscopy to be a single chromatid with its kinetochore attached to kinetochore microtubule bundles extending toward opposite poles. This merotelic orientation was verified by electron microscopy. The single kinetochores of lagging chromosomes in anaphase were stretched laterally (1.2--5.6-fold) in the directions of their kinetochore microtubules, indicating that they were not able to achieve anaphase poleward movement because of pulling forces toward opposite poles. They also had inactivated mitotic spindle checkpoint activities since they did not label with either Mad2 or 3F3/2 antibodies. Thus, for mammalian cultured cells, kinetochore merotelic orientation is a major mechanism of aneuploidy not detected by the mitotic spindle checkpoint. The expanded and curved crescent morphology exhibited by kinetochores during nocodazole treatment may promote the high incidence of kinetochore merotelic orientation that occurs after nocodazole washout.


Figures

Figure 2
Figure 2
Fluorescent and phase–contrast images of PtK1 cells fixed at anaphase and immunostained for kinetochores with CREST antibody and for microtubules with anti–α-tubulin antibody. The overlay of phase–contrast and CREST images (left column) and α-tubulin and CREST images (right column) is shown. The CREST and microtubule fluorescent images were obtained by projecting into a single image the maximal brightness at each pixel location through a stack of optical sections acquired at 0.2-μm intervals through the immunostained cells by confocal fluorescence microscopy. (a and a′) Normal metaphase. Sister kinetochores exhibit punctuate CREST fluorescence and they appear completely separated from each other because of the stretching induced on centromeric chromatin. (b and b′) Normal anaphase. (c and c′) Example of a lagging chromosome in an untreated anaphase cell (arrows point at the kinetochore of the lagging chromosome). (d–f′) Examples of single or multiple lagging chromosomes in anaphase cells during recovery from a nocodazole-induced mitotic block (arrows point at the kinetochores of lagging chromosomes). The CREST- and α-tubulin–merged images show clearly that the kinetochores of lagging chromosomes in anaphase are connected to microtubules coming from both poles (merotelic attachment) and that the CREST-stained region is stretched compared with the kinetochores correctly localized to the spindle poles. Bar, 5 μm.
Figure 1
Figure 1
Fluorescent images of lagging chromosomes in PtK1 cells fixed at late anaphase. Kinetochores were stained with CREST antibodies (pseudocolored green), whereas chromosomal DNA was stained with DAPI (pseudocolored red). Examples of a single lagging chromosome in an untreated cell (a) and multiple lagging chromosomes in a cell recovering from a nocodazole-induced mitotic arrest (b). Lagging chromosomes are single chromatids with only one CREST signal. (c) The graph shows the frequencies of anaphase cells with lagging chromosomes in nocodazole-released and untreated cells (the cells showing lagging of two paired sister chromatids were not included in the analysis, since they represent a rarely occurring event both in untreated cells and in cells recovering from a mitotic block). The data obtained in six independent experiments, in which only CREST staining or both CREST and α-tubulin immunostaining were performed, were pooled together, since no statistically significant differences were observed (by χ2 test, P > 0.1). 1,631 control anaphases and 758 nocodazole-released anaphases were analyzed for the presence of lagging chromosomes. Bar, 5 μm.
Figure 3
Figure 3
CREST (left) and α-tubulin (middle) immunostaining of the kinetochore region of three lagging chromosomes observed in anaphase cells. α-Tubulin immunostaining (middle) clearly shows a lack of fluorescence in the region where the kinetochore is localized, indicating that most of the microtubules coming from the opposite spindle poles end on the kinetochore. A few microtubules run through the kinetochore region, indicating that interpolar microtubules are clustered near kinetochore microtubule bundles. The overlay of CREST and α-tubulin immunostaining is shown in the right column. Bar, 1 μm.
Figure 4
Figure 4
Electron micrographs showing sequential-thick sections (a–c) through the merotelically oriented kinetochore of a lagging chromosome in a cell fixed at late anaphase. In panels b and c, kinetochore microtubules can be seen extending from the left side (left arrow) of the kinetochore toward the left spindle pole and from the right side of the kinetochore (right arrow) to the right spindle pole. (d) 3-D structure of the organization of kinetochore microtubules attached to the merotelically oriented kinetochore shown in panels b and c. The reconstruction was obtained from stereopairs for the two consecutive sections containing the kinetochore. The kinetochore is color encoded in yellow, the microtubule axes are green, and the chromatin proximal to the kinetochore is red. The figure clearly shows 5 kinetochore microtubules extending toward one pole and 11 kinetochore microtubules extending toward the opposite pole. It also clearly shows that the kinetochore is stretched laterally beyond the centromere region of the chromosome. For clarity, interpolar microtubules that pass near the kinetochore are not shown. A rotatable, 3-D file of panel d is available at http://www.jcb.org/cgi/content/full/153/3/517/DC1. Bar, 0.5 μm.
Figure 5
Figure 5
Merotelic kinetochore orientation in a late prometaphase cell observed 15 min after release from a mitotic block with 2 μM nocodazole. The figure shows that merotelic kinetochore orientation occurs by late prometaphase on chromosomes near the spindle equator. Two different angles of a projection from a deconvolved 3-D image stack are shown in panels a and b. Higher magnification views of the central region of the spindle containing the merotelically oriented kinetochores (arrows) are shown in panels a′ and b′. Spindle microtubules are red and kinetochores stained with CREST antibody are green. By rotating the 3-D reconstructed image, microtubule bundles ending at a single kinetochore (a′ and b′, arrows) could be easily discriminated from bundles of microtubules which were aligned with kinetochores, but not connected to them (a′ and b′, left arrowhead). By further rotating the 3-D image, the kinetochore indicated by the right arrowhead was seen attached only to one microtubule bundle and not to microtubules coming from both poles. Note that the kinetochore CREST staining has a bilobed kidney shape for both normal and merotelically oriented kinetochores at the higher resolution achieved by 3-D image processing and deconvolution. Also, note that the right merotelically oriented kinetochore appears stretched in comparison to kinetochores with kinetochore fibers from one pole only. A Quicktime® movie of this figure is available at http://www.jcb.org/cgi/content/full/153/3/517/DC1. Bars: (b) 2 μm; (b′) 0.5 μm.
Figure 7
Figure 7
Mad2 (a–c) and 3F3/2 (d–f) immunostaining in untreated, nocodazole-treated cells and cells fixed after 1 h recovery from a nocodazole-induced mitotic arrest. Overlays of differential interference contrast (DIC) and fluorescence images are shown. Mad2 and 3F3/2 staining are present on the kinetochores of unattached and unaligned chromosomes in prometaphase (a and d), are enhanced on the kinetochores of nocodazole-arrested cells (b and e), but are not present on the kinetochores of lagging chromosomes (or chromosomes normally moved to the spindle poles) in anaphase cells (c and f). The insets in the bottom right corners of panels b and e show higher magnifications of crescent-shaped kinetochores highlighted by a square in the pictures. Bar, 5 μm.
Figure 6
Figure 6
Analysis of kinetochore stretching. (a) Kinetochores seen by CREST staining. (Left) Example of sister kinetochores on a bioriented chromosome aligned at the equator in a metaphase PtK1 cell. The two sister kinetochores are completely separated from each other because of the stretching induced on centromeric chromatin, and the interkinetochore distance is ∼2 μm. (Middle) Kinetochore correctly transported to the pole in an anaphase cell recovering from a nocodazole-induced mitotic block. The maximal width of this kinetochore is typical of kinetochores near the pole at anaphase, ∼0.6 μm. (Right) Stretched kinetochore on a lagging chromosome left behind after anaphase onset in a cell recovering from a nocodazole-induced mitotic block. The length of this kinetochore is 3.14 μm. These images are all oriented with the spindle axis approximately vertical. (b) Measurements of maximal kinetochore width for normal anaphase chromosomes (correctly moved to the spindle poles) or lagging chromosomes in ana-telophase PtK1 cells after 1 h release from a nocodazole-induced mitotic arrest. The histograms show the means ± SE of the maximal kinetochore width. n, number of measured kinetochores. Bar, 0.5 μm.
Figure 8
Figure 8
Proposed events that drive the production of lagging chromosomes in anaphase through merotelic kinetochore orientation. (a) Spindle disassembly induced by the nocodazole mitotic block promotes the expansion and curvature of the outer domain of kinetochores around their centromeric DNA. (b) A slow compaction of the kinetochore outer domain when the spindle reassembles after nocodazole removal may promote the unusually high frequency of merotelic kinetochore orientation that occurs by the time chromosomes have moved to near the spindle equator in prometaphase. (c) A merotelically oriented kinetochore does not move poleward like normal kinetochores at anaphase because it does not split apart like sister kinetochores at anaphase onset, but instead remains under tension and becomes further stretched by poleward forces directed along its kinetochore microtubules to opposite poles.

Similar articles

Cited by

References

    1. Agard D.A., Hiraoka Y., Shaw P., Sedat J.W. Fluorescence microscopy in three dimensions. Methods Cell Biol. 1989;30:353–377. - PubMed
    1. Canman J.C., Hoffman D., Salmon E.D. The role of pre- and post-anaphase microtubules in the cytokinetic phase, or C-phase, of the cell cycle. Curr. Biol. 2000;10:611–614. - PubMed
    1. Catalán J., Falck G.C.-M., Norppa H. The X chromosome frequently lags behind in female lymphocyte anaphase. Am. J. Hum. Genet. 2000;66:687–691. - PMC - PubMed
    1. Cimini D., Antoccia A., Tanzarella C., Degrassi F. Topoisomerase II inhibition in mitosis produces numerical and structural chromosomal aberrations in human fibroblasts. Cytogenet. Cell Genet. 1997;76:61–67. - PubMed
    1. Cimini D., Tanzarella C., Degrassi F. Differences in malsegregation rates obtained by scoring ana-telophase or binucleate cells. Mutagenesis. 1999;14:563–568. - PubMed

Publication types

MeSH terms