. 2001 Apr 30;153(3):529-41.
doi: 10.1083/jcb.153.3.529.

Rapid cycling of lipid raft markers between the cell surface and Golgi complex

Affiliations

Rapid cycling of lipid raft markers between the cell surface and Golgi complex

B J Nichols et al. J Cell Biol. .

Abstract

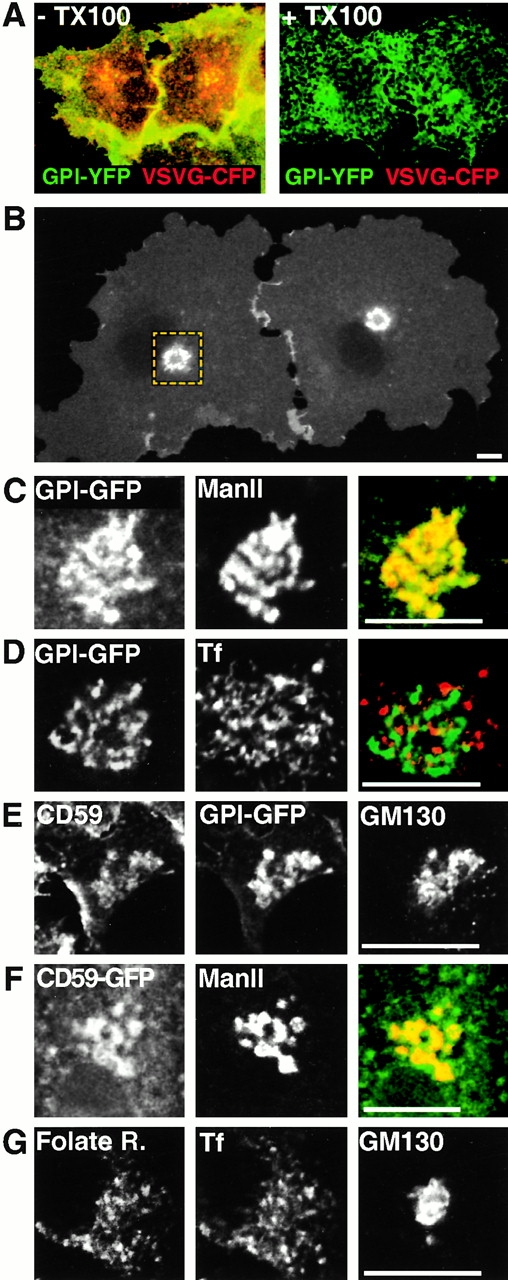
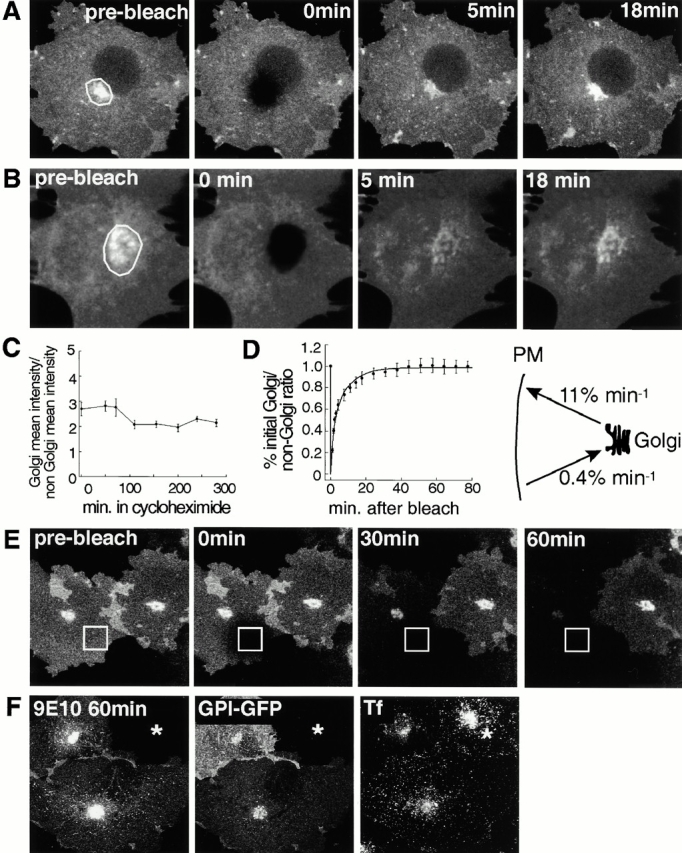
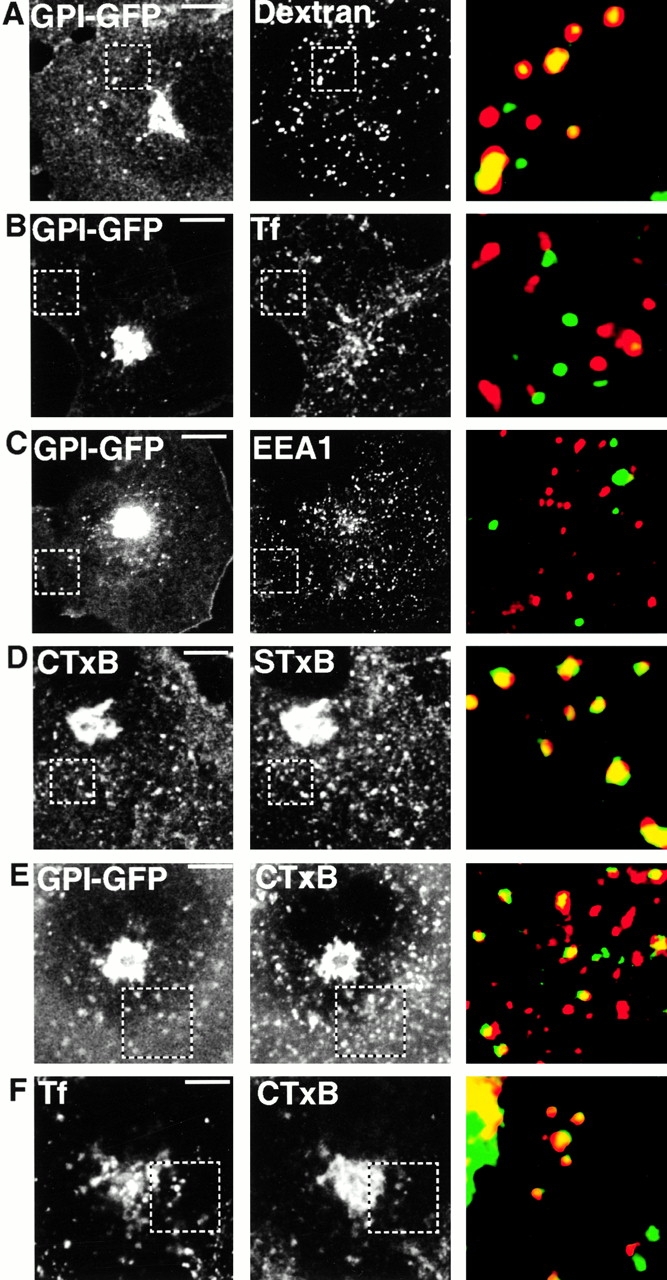
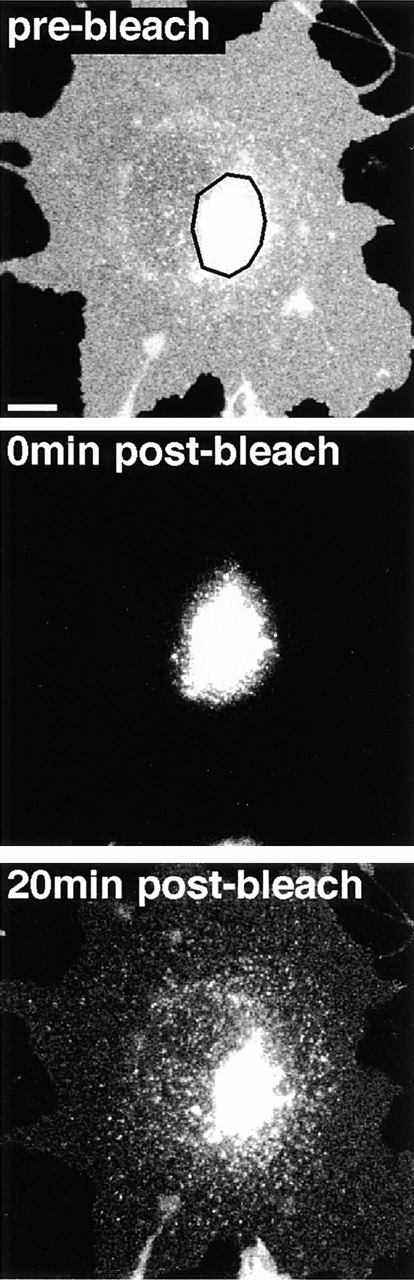
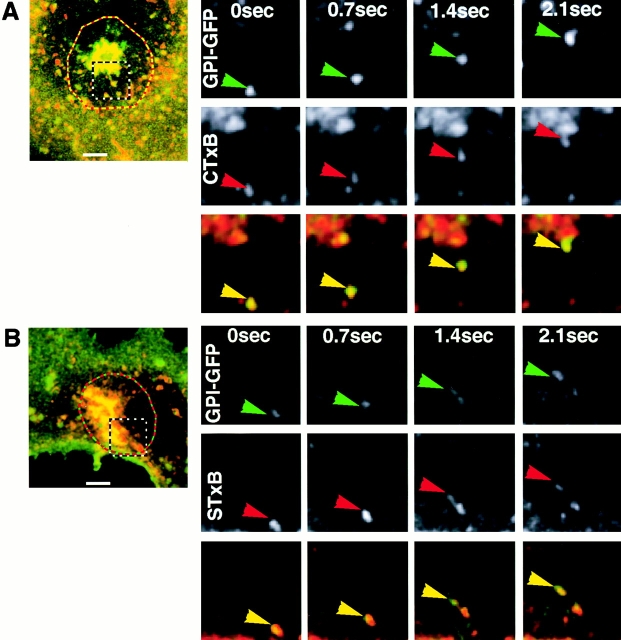
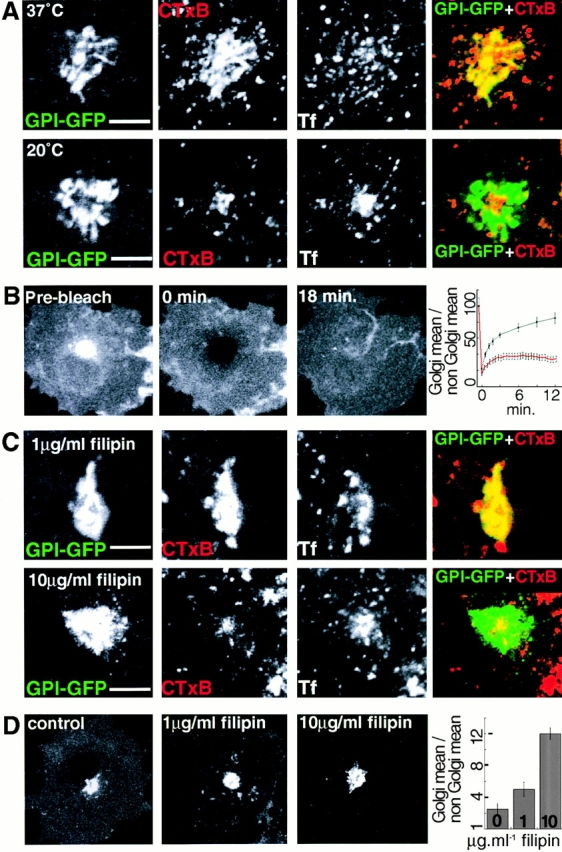
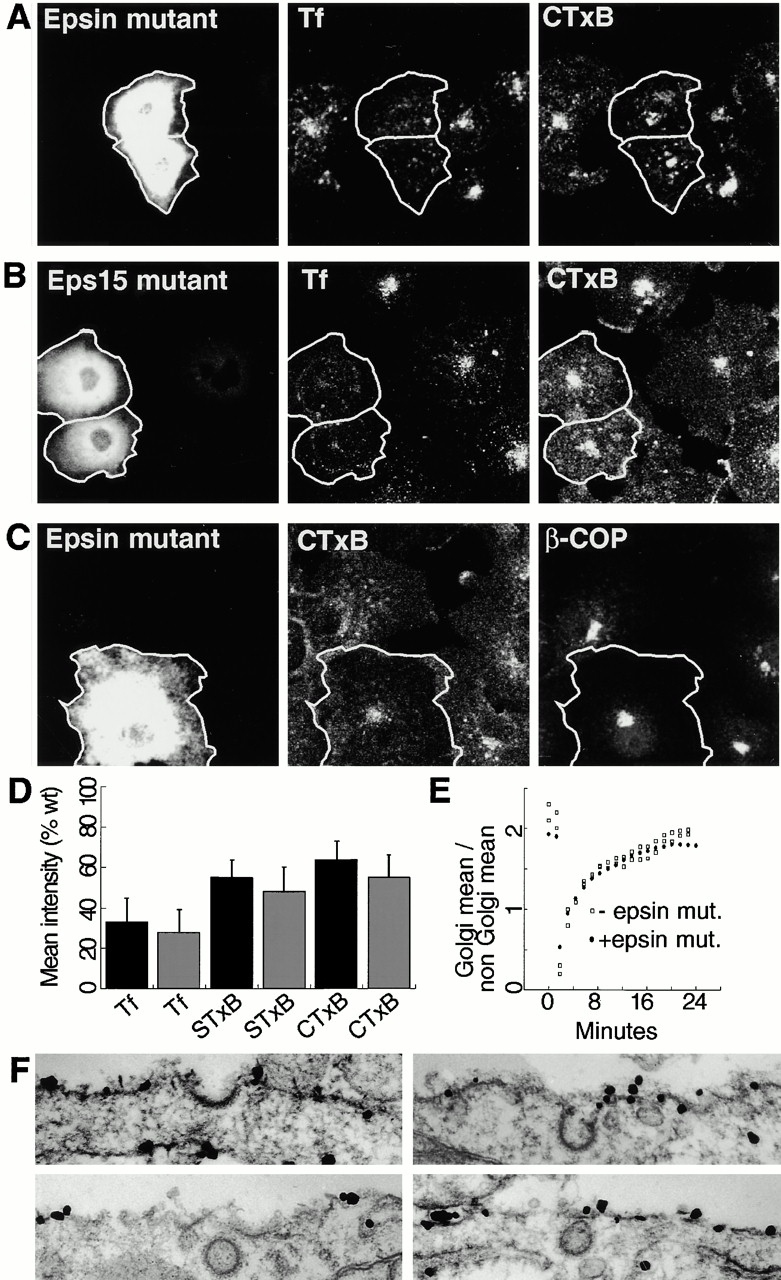
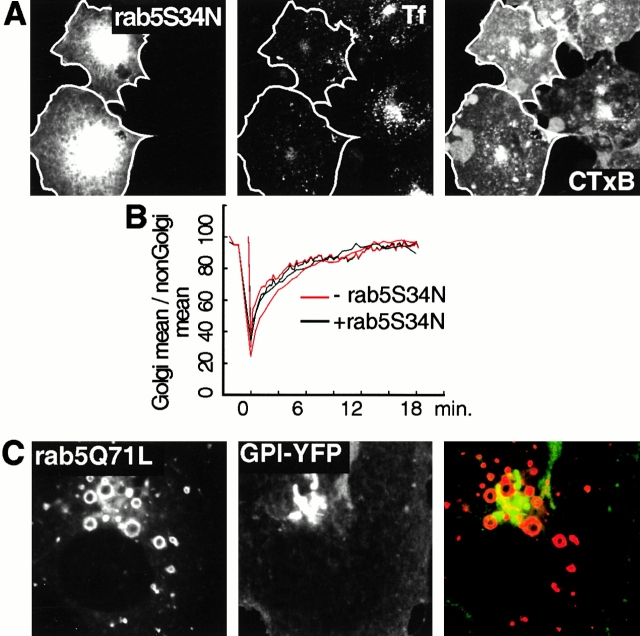
The endocytic itineraries of lipid raft markers, such as glycosyl phosphatidylinositol (GPI)-anchored proteins and glycosphingolipids, are incompletely understood. Here we show that different GPI-anchored proteins have different intracellular distributions; some (such as the folate receptor) accumulate in transferrin-containing compartments, others (such as CD59 and GPI-linked green fluorescent protein [GFP]) accumulate in the Golgi apparatus. Selective photobleaching shows that the Golgi pool of both GPI-GFP and CD59-GFP constantly and rapidly exchanges with the pool of these proteins found on the plasma membrane (PM). We visualized intermediates carrying GPI-GFP from the Golgi apparatus to the PM and separate structures delivering GPI-GFP to the Golgi apparatus.GPI-GFP does not accumulate within endocytic compartments containing transferrin, although it is detected in intracellular structures which are endosomes by the criteria of accessibility to a fluid phase marker and to cholera and shiga toxin B subunits (CTxB and STxB, which are also found in rafts). GPI-GFP and a proportion of the total CTxB and STxB taken up into cells are endocytosed independently of clathrin-associated machinery and are delivered to the Golgi complex via indistinguishable mechanisms. Hence, they enter the Golgi complex in the same intermediates, get there independently of both clathrin and rab5 function, and are excluded from it at 20 degrees C and under conditions of cholesterol sequestration. The PM-Golgi cycling pathway followed by GPI-GFP could serve to regulate lipid raft distribution and function within cells.


Figures

Figure 1
Figure 1
Localization of specific GPI-anchored proteins to the Golgi complex. (A) Triton X-100 extraction of COS-7 cells expressing GPI-CFP (green) and VSVG-YFP (red). (B) GFP fluorescence from GPI-GFP expressed in COS-7 cells. Similar distributions were seen in NRK, HeLa, and MDCK cells. (C) Immunofluorescence staining comparing the distribution of a Golgi enzyme, mannosidase II, with that of the perinuclear pool of GPI-GFP in NRK cells. Only a restricted region of the cell, equivalent to the boxed area in A, is shown. (D) Perinuclear distribution of Cy3-transferrin and GPI-GFP in NRK cells. (E) Triple-labeling of a HeLa cell for endogenous CD59, GPI-GFP, and the Golgi marker GM130. (F) Comparison of CD59-GFP and mannosidase II distributions in COS-7 cells. (G) Triple-labeling of a HeLa cell for endogenous folate receptor, Cy3-transferrin, and GM130. Bars, 5 mm.
Figure 2
Figure 2
Constitutive cycling of GPI-GFP and CD59-GFP between the Golgi complex and the PM. (A) The Golgi pool of GPI-GFP recovers rapidly after photobleach. The area enclosed by a white line in the prebleach image was photobleached. The times shown in the second two panels denote minutes postbleach. COS-7 cells were pretreated with 200 μg/ml cycloheximide for 2 h before photobleaching. (B) The Golgi pool of CD59-GFP recovers rapidly after photobleach. The experiment was carried out as in Fig. 1 C. (C) The Golgi pool of GPI-GFP is not dependent on new protein synthesis. The ratio between mean fluorescence intensity in the Golgi region and mean fluorescence intensity in the rest of the cell is then plotted as a function of time after addition of 200 μg/ml cycloheximide to COS-7 cells. n ≥ 15 ± SE. (D) The Golgi pool of GPI-GFP recovers after photobleach; quantitation and kinetics. The Golgi pool of GPI-GFP was eliminated by photobleach as shown in C. Mean fluorescence intensity of Golgi and non-Golgi pools was determined at the times indicated and expressed as a percentage of the prebleach ratio between these values (filled circles). These data were applied to a kinetic model (see Materials and Methods) so as to derive rate constants describing exchange between Golgi and PM pools. The solid line gives the recovery curve predicted by this model, and rate constants are shown in the adjacent cartoon. Cells were pretreated with 200 μg/ml cycloheximide for 2 h before the experiment. n = 6 ± SE. (E) Depletion of the cell surface pool of GPI-GFP by repeated photobleaching leads to depletion of the Golgi pool. The area enclosed by a white box was completely photobleached every minute. Cells were not cycloheximide treated. (F) Anti-myc antibody 9E10 is endocytosed to the Golgi complex specifically in cells expressing (myc-tagged) GPI-GFP. Antibody uptake experiments are described in detail in Materials and Methods. The asterisk highlights a cell not expressing GPI-GFP, but labeled with Cy3-transferrin. The perinuclear clustering of transferrin in cells after 60 min of uptake represents recycling endosomes which are devoid of GPI-GFP (Fig. 1 D). Supplemental video available at http://www.jcb.org/cgi/content/full/153/3/529/DC1.
Figure 4
Figure 4
Characterization of endosomes containing GPI-GFP, STxB, and CTxB. In all images the dashed boxes indicate the area shown in the adjacent color panel. Color images have all been processed by adjusting the black level and maximal pixel intensity level in order to aid comparison of the distribution of scattered punctate structures. Cells are COS-7 and were all fixed. (A) Endocytosed 10K Fluoro-Ruby™ dextran labels structures containing GPI-GFP. (B) Endocytosed Cy3-transferrin labels different structures from those containing GPI-GFP. (C) GPI-GFP is not present in EEA1-positive endosomes (D) Endocytosed STxB-Cy3 and CTxB-Cy5 have the same intracellular distribution. (E) Endocytosed CTxB labels structures containing GPI-GFP. (F) Endocytosed CTxB-Cy3 is found both in the Golgi complex, as labeled by GPI-GFP, and in recycling endosomes as labeled by transferrin-Cy5. Bars, 5 μm.
Figure 3
Figure 3
Exocytic transport intermediates carrying GPI-GFP. GPI-GFP was expressed in COS-7 cells. All fluorescence outside of the region indicated in the prebleach image was eliminated by photobleaching. Note that the fluorescence intensity of the Golgi region is saturated (pixel value equals 255 for 8-bit images) in all of these images to allow visualization of the less bright transport intermediates. Times in subsequent panels are relative to the end of the photobleach. Supplemental video available at http://www.jcb.org/cgi/content/full/153/3/529/DC1. Bar, 5 μm.
Figure 5
Figure 5
GPI-GFP enters the Golgi complex in endocytic transport intermediates containing both CTxB-Cy3 (A) and STxB-Cy3 (B). The area inside the red and yellow dashed line was photobleached, and the time-lapse images shown are of the boxed region. Times shown are relative to the first image in the series. Supplemental video available at http://www.jcb.org/cgi/content/full/153/3/529/DC1. Bars, 5 μm.
Figure 8
Figure 8
Effect of a 20°C block and cholesterol depletion on GPI-GFP, STxB, and CTxB trafficking. (A) Incubation at 20°C blocks delivery of CTxB-Cy5 to the Golgi complex, but not uptake of transferrin-Cy3. GPI-GFP–expressing COS-7 cells were incubated at the temperature indicated for 40 min before labeling with transferrin-Cy3 and CTxB-Cy5. Color images display the distributions of CTxB (red) and GPI-GFP (green). (B) Incubation at 20°C blocks delivery of GPI-GFP to the Golgi complex. GPI-GFP–expressing COS-7 cells were incubated at the temperature indicated for 40 min before photobleach of the Golgi pool. An equivalent experiment carried out at 37°C is shown in Fig. 2 C. The graph compares the recovery of the Golgi pool of GPI-GFP after photobleaching at 37°C (black line) and 25°C (red lines). The apparent rapid increase in the Golgi pool immediately after photobleaching at 20°C is due to lateral diffusion of GPI-GFP on the PM into the Golgi region. n = 4 for both data sets. (C) Filipin treatment blocks delivery of CTxB-Cy5 to the Golgi complex. COS-7 cells were exposed to filipin at the concentrations shown for 1 h. Only the juxtanuclear, Golgi region of the cells is shown. Color images display the distributions of CTxB (red) and GPI-GFP (green). Transferrin-Cy3 and CTxB-Cy5 uptake were as described in Materials and Methods. (D) Filipin treatment causes redistribution of GPI-GFP from the cell surface to the Golgi complex. Fluorescence images are of GPI-GFP expressed in COS-7 cells 1 h after treatment with the concentration of filipin shown. Note that to avoid pixel saturation, different imaging conditions are used for each image. The bar graph shows quantitation of the mean fluorescence intensity within the Golgi region as a ratio with that of the non-Golgi region. n ≥ 10 ± SE. Total GPI-GFP fluorescence intensity in filipin-treated cells changed slightly; total fluorescence was 80 ± 7%, n = 14, of initial fluorescence after 1 h in 10 μg/ml filipin. Bars, 5 μm.
Figure 6
Figure 6
GPI-GFP, STxB, and CTxB are internalized via a clathrin-independent process. (A) Expression of a dominant negative mutant of epsin blocks transferrin-Cy3 uptake more than uptake of CTxB-Cy5. Epsin mutant was expressed by transient transfection of COS-7 cells and detected with anti-FLAG epitope antibodies. Uptake of both markers was for 25 min. (B) Expression of a dominant negative mutant of eps15 blocks transferrin-Cy3 uptake more than uptake of CTxB-Cy5. Eps15 mutant tagged with GFP was expressed by transient transfection of COS-7 cells. Uptake of both markers was for 25 min. (C) Expression of the dominant negative epsin mutant does not block delivery of CTxB-Cy3 to the Golgi complex. The Golgi complex was labeled with antibodies against β-COP and a Cy5-conjugated secondary. (D) Quantitation of the effects of epsin (black bars) and eps15 (grey bars) mutants on transferrin, STxB, and CTxB uptake. Mean fluorescence intensity from STxB, CTxB, or transferrin taken up over 25 min by mutant-transfected cells is expressed as a percentage of the same value from surrounding nontransfected cells. Bars are ± SE; n ≥ 10. (E) Quantitation of the effects of Epsin mutant on GPI-GFP uptake. The graph shows data from a typical experiment where the Golgi complex in normal (□) or epsin mutant–microinjected (•) cells was photobleached (as in Fig. 2 A and 6 D) at time = 0 s. Mean fluorescence intensity of the Golgi region is expressed as a ratio with the mean fluorescence intensity outside the Golgi as in previous experiments. (F) Immunoelectron microscopy showing distribution of GPI-GFP on the cell surface.
Figure 7
Figure 7
GPI-GFP, CTxB, and STxB do not required rab5 activity for delivery to the Golgi complex. (A) Expression of a dominant negative mutant of rab5 (S34N) blocks intracellular accumulation of transferrin-Cy3 without preventing delivery of CTxB-Cy5 to the Golgi complex. Rab5 mutant tagged with CFP was expressed by transient transfection of COS-7 cells; uptake of both ligands was for 25 min. (B) Kinetics for exchange of GPI-YFP between cell surface and Golgi pools is unaffected by rab5 S34N. Cycloheximide-treated COS-7 cells coexpressing rab5 S34N–CFP and GPI-YFP were loaded with Cy5–transferrin to identify cells where rab5 S34N expression was sufficient to significantly impair transferrin uptake. The Golgi pool of GPI-YFP in these cells was bleached and recovery followed with time as in Fig. 2 A. (C) GPI-YFP does not accumulate in the aberrant early endosomes induced by expression of rab5 Q79L. Rab5 Q79L–CFP and GPI-YFP were coexpressed in COS-7 cells.

References

    1. Benting J.H., Rietveld A.G., Simons K. N-glycans mediate the apical sorting of a GPI-anchored, raft-associated protein in Madin-Darby canine kidney cells. J. Cell Biol. 1999;146:313–320. - PMC - PubMed
    1. Benmerah A., Bayrou M., Cerf-Bensussan N., Dautry-Varsat A. Inhibition of clathrin-coated pit assembly by an Eps15 mutant. J. Cell Sci. 1999;112:1303–1311. - PubMed
    1. Bretscher M.S., Munro S. Cholesterol and the Golgi apparatus. Science. 1993;261:1280–1281. - PubMed
    1. Brown D.A., London E. Functions of lipid rafts in biological membranes. Annu. Rev. Cell Dev. Biol. 1998;14:111–136. - PubMed
    1. Chen H., Fre S., Slepnev V.I., Capua M.R., Takei K., Butler M.H., Di Fiore P.P., De Camilli P. Epsin is an EH-domain-binding protein implicated in clathrin-mediated endocytosis. Nature. 1998;394:793–797. - PubMed

Publication types