. 2001 Apr 30;153(3):569-84.
doi: 10.1083/jcb.153.3.569.

Rho-kinase--mediated contraction of isolated stress fibers

Affiliations

Rho-kinase--mediated contraction of isolated stress fibers

K Katoh et al. J Cell Biol. .

Abstract

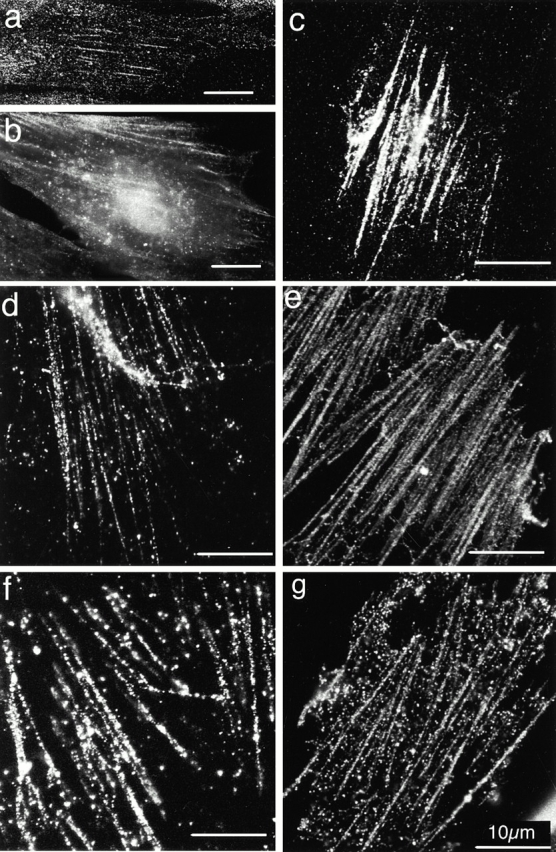
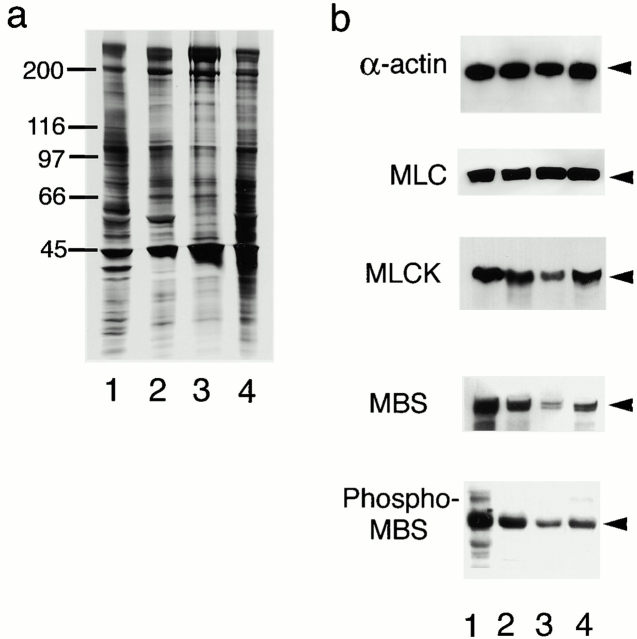
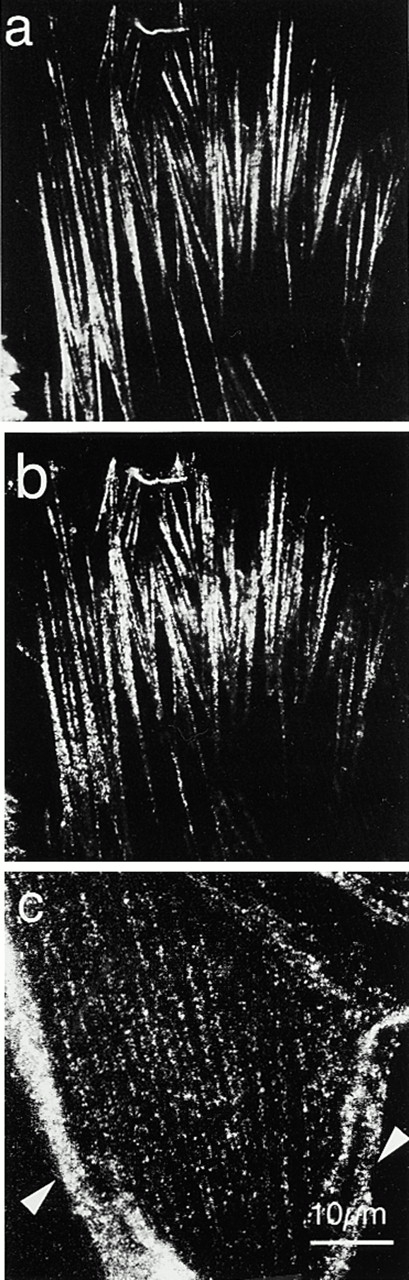
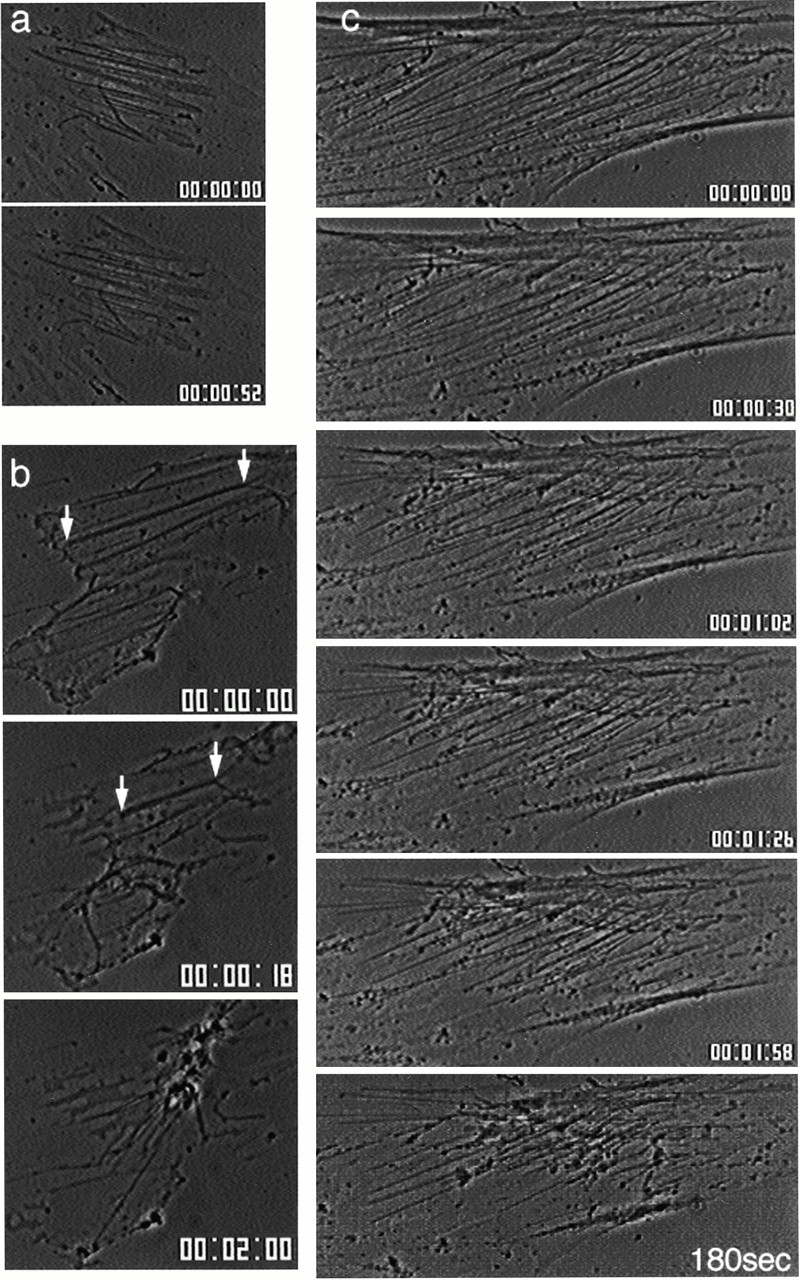
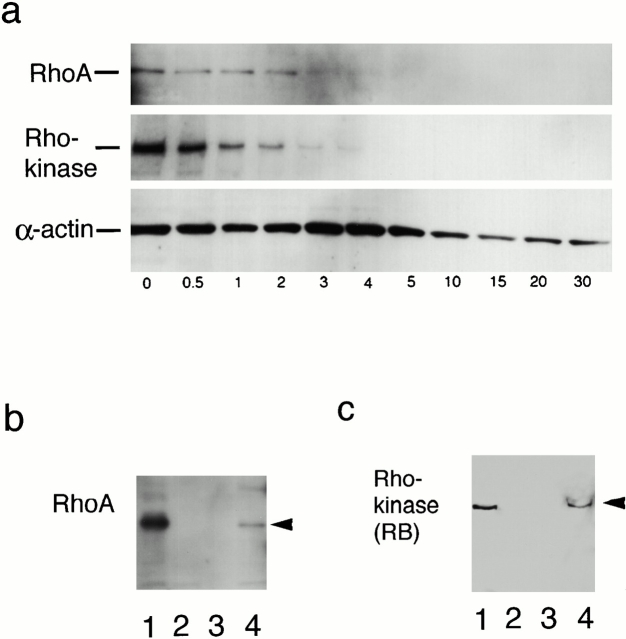
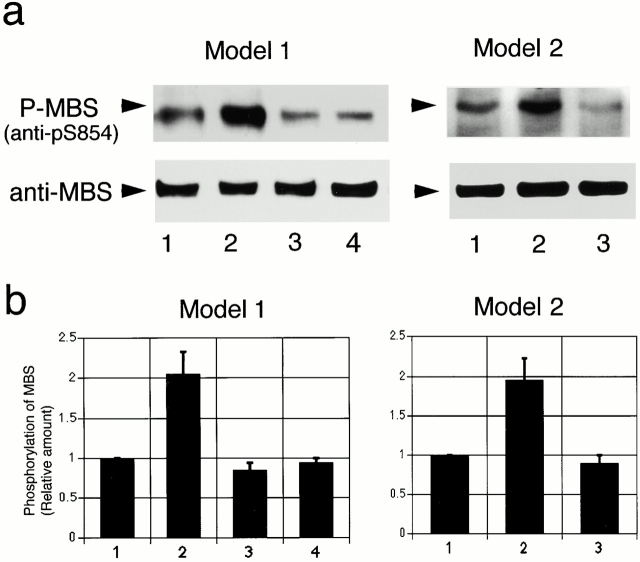
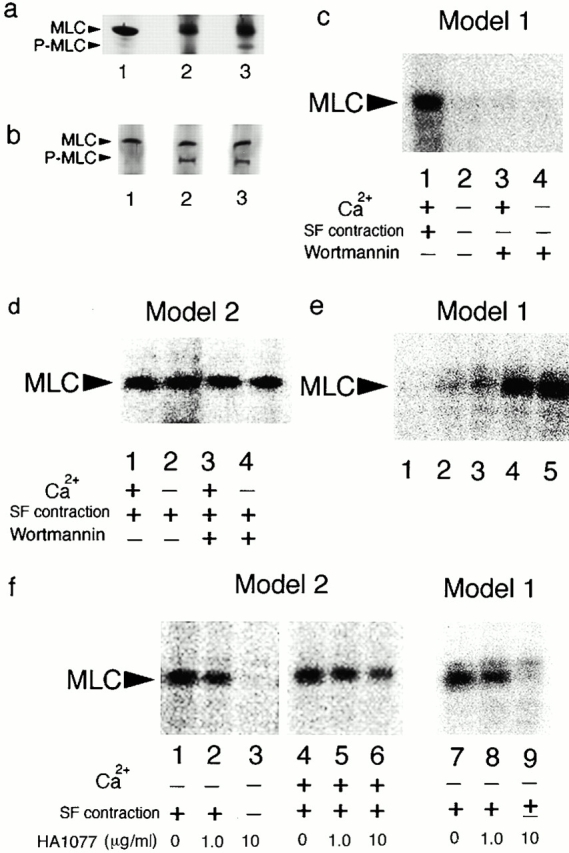
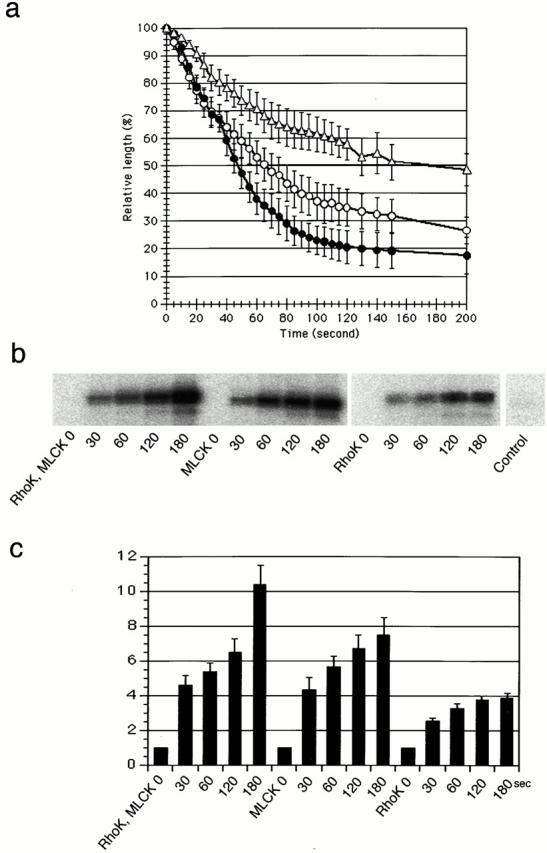
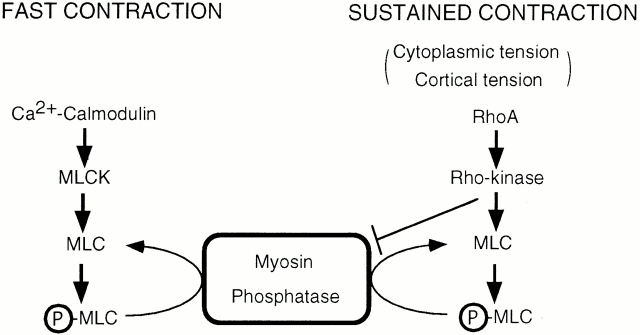
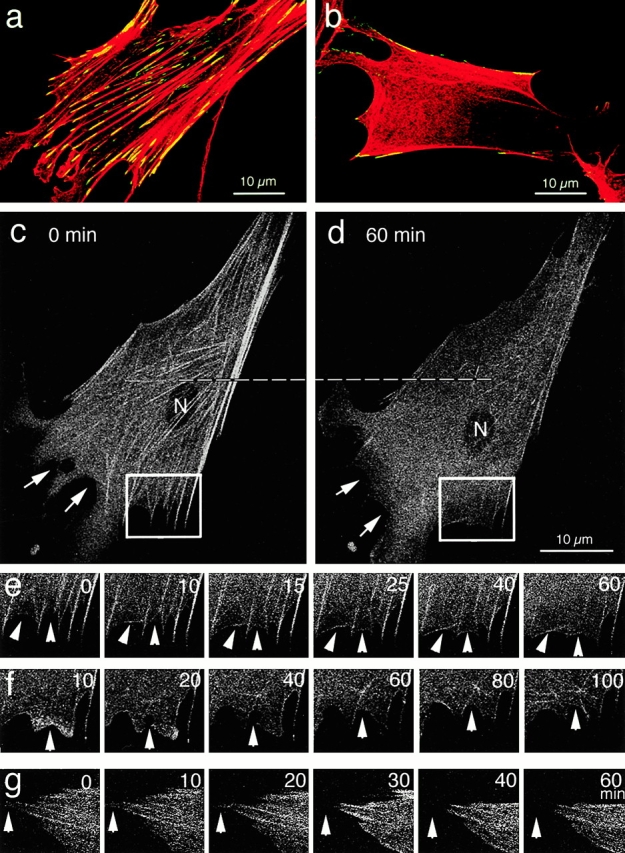
It is widely accepted that actin filaments and the conventional double-headed myosin interact to generate force for many types of nonmuscle cell motility, and that this interaction occurs when the myosin regulatory light chain (MLC) is phosphorylated by MLC kinase (MLCK) together with calmodulin and Ca(2+). However, recent studies indicate that Rho-kinase is also involved in regulating the smooth muscle and nonmuscle cell contractility. We have recently isolated reactivatable stress fibers from cultured cells and established them as a model system for actomyosin-based contraction in nonmuscle cells. Here, using isolated stress fibers, we show that Rho-kinase mediates MLC phosphorylation and their contraction in the absence of Ca(2+). More rapid and extensive stress fiber contraction was induced by MLCK than was by Rho-kinase. When the activity of Rho-kinase but not MLCK was inhibited, cells not only lost their stress fibers and focal adhesions but also appeared to lose cytoplasmic tension. Our study suggests that actomyosin-based nonmuscle contractility is regulated by two kinase systems: the Ca(2+)-dependent MLCK and the Rho-kinase systems. We propose that Ca(2+) is used to generate rapid contraction, whereas Rho-kinase plays a major role in maintaining sustained contraction in cells.


Figures

Figure 3
Figure 3
RhoA and Rho-kinase association with stress fibers. (a) A confocal image of stress fibers stained with anti–Rho-kinase (CC). The specimen was stained after the standard immunofluorescence procedure. (b) Cells were briefly extracted with Triton X-100 and stained with anti–Rho-kinase (CC). Using an epifluorescence microscope, stress fiber staining was detected against cytoplasmic staining. (c–e) Model 1 stress fibers treated with Triton X-100 for <3 min were stained with anti-RhoA (c) and anti–Rho-kinases, CC (d) and RB (e). Dotty staining along stress fibers was noted. (f and g) Model 2 stress fibers showed the similar dotted staining pattern with anti-RhoA (f) and anti–Rho-kinase (RB) (g). Bars, 10 μm.
Figure 1
Figure 1
Gel electrophoresis and immunoblotting of stress fiber models with various antibodies. The whole cell extract (lane 1), Triton X-100–insoluble fraction of cells (lane 2), and model 1 (lane 3) and 2 (lane 4) stress fibers of human foreskin fibroblasts were electrophorased and silver stained (a) or immunoblotted (b) with anti–α-actin (α-actin), anti-MLC (MLC), anti-MLCK (MLCK), anti-MBS (MBS), or anti-phosphorylated MBS (phospho-MBS). Data indicate that all of these antigen polypeptides are associated with the cytoskeletal fraction and both stress fiber models. The amount of protein loaded to each lane was 2 μg for electrophoresis and 10 μg for immunoblotting.
Figure 2
Figure 2
Immunofluorescence localization of myosin, MBS, and phosphorylated MBS in model 1 stress fibers. Stress fibers doubly stained with antimyosin (a) and anti-MBS (b) show dotty fluorescent patterns. When the two staining patterns were overlaid, many spots were superimposable. Banded anti–phosphorylated MBS staining is shown in c. Arrowheads in c indicate the peripheral stress fibers. Bar, 10 μm.
Figure 5
Figure 5
Ca2+-independent contraction of isolated stress fibers. (a) Model 1 stress fibers were unable to contract when perfused with Mg-ATP without Ca2+. (b) Under the same condition, model 2 stress fibers contracted (arrows). (c) Model 1, incubated with 5.1 μg/ml of dominant-active Rho-kinase, was exposed to Mg-ATP without Ca2+. Active contraction was observed. Time (h:min:s) is shown at the bottom right side in each micrograph.
Figure 4
Figure 4
Extraction of RhoA and Rho-kinase from cells and stress fibers by Triton X-100. (a) Model 1 stress fibers were exposed to Triton X-100 for varying lengths of time (indicated in min) and analyzed for the content of RhoA and Rho-kinase by immunoblotting. RhoA and Rho-kinase were no longer detectable after 5 min of extraction. (b) RhoA, detectable in the whole cell extract (lane 1), could not be detected in the cell extracted by Triton X-100 for 10 min (lane 2). Although RhoA was not detected in model l stress fibers that were treated with Triton X-100 for 10 min (lane 3), it was associated with model 2 stress fibers (Lane 4). (c) Under these same experimental conditions, Rho-kinase was similarly extracted by Triton X-100. (a) Same amounts of TEA-treated samples were exposed to Triton X-100 for varying lengths of time. (b and c) 10 μg of proteins were loaded in each lane.
Figure 6
Figure 6
MBS phosphorylation in isolated stress fibers. (a) The phosphorylation levels of MBS in models 1 and 2 (top) are shown. The level of MBS phosphorylation in freshly isolated stress fibers was low in general in model 1 (model 1, lane 1), but it was clearly detectable in model 2 (model 2, lane 1). When model 1 stress fibers were incubated with Ca2+-free Mg-ATP and 5.1 μM constitutively active Rho-kinase, MBS was phosphorylated (model 1, lane 2). This phosphorylation was inhibited by Y-27632 (10 μM) (model 1, lane 3). No increase in MBS phosphorylation occurred during model 1 stress fiber contraction induced by Mg-ATP with Ca2+ (model 1, lane 4). In model 2, the phosphorylation level of MBS increased when stress fibers were incubated with Ca2+-free Mg-ATP (model 2, lane 2). This MBS phosphorylation was also inhibited by Y-27632 (model 2, lane 3). Phosphorylated MBS was detected by using anti-pS854. The total amount of MBS in each lane was detected by anti-MBS and was essentially identical. 10 μg of proteins were loaded in each lane. (b) Quantitative analyses MBS of phosphorylation are shown. The immunoblotted bands were quantified by densitometry. The level of MBS phosphorylation in freshly isolated samples was recorded as 1, and all the data are expressed relative to this value. Each bar represents mean ± SE of four (model 1) or five (model 2) independent experiments.
Figure 7
Figure 7
MLC phosphorylation and stress fiber contraction. MLC phosphorylation was detected by a urea gel system or autoradiography of SDS gels, and stress fiber contraction was monitored for each experimental condition under a phase–contrast microscope (+, contracted; −, not contracted). (a) Little or no phosphorylated MLC was present in freshly isolated model 1 stress fibers (lane 2). When model 1 stress fibers were treated with Mg-ATP in the presence of Ca2+, they contracted, and phosphorylated MLC could be detected (lane 3). Lane 1 is unphosphorylated chicken gizzard MLC. (b) Little or no phosphorylated MLC was present in model 2 stress fibers (lane 1). When model 2 stress fibers were treated with Mg-ATP in the presence (lane 2) or absence (lane 3) of Ca2+, they contracted, and MLC phosphorylated in both cases. (c) MLC phosphorylation in model 1 stress fibers was Ca2+-dependent and was inhibited by wortmannin. Model 1 stress fibers were incubated in radio-labeled ATP with (lane 1) or without (lane 2) Ca2+. The same samples shown in lanes l and 2 were pretreated with 10 μM wortmannin before the addition of radio-labeled ATP (lanes 3 and 4, respectively). The Ca2+-dependent MLC phosphorylation was inhibited by the MLCK inhibitor (lane 3). (d) MLC phosphorylation in model 2 stress fibers was independent of Ca2+ (lanes 1 and 2). The gel sample for each lane was treated in the same manner as the one shown in c. Wortmannin failed to inhibit MLC phosphorylation in model 2 (lanes 3 and 4). (e) Model 1 stress fibers were first incubated with 0 (lane 1), 0.005 (lane 2), 0.05 (lane 3), 0.51 (lane 4), or 5.1 (lane 5) μg/ml dominant-active Rho-kinase and then with radio-labeled ATP in the absence of Ca2+. Rho-kinase concentration–dependent phosphorylation was observed. (f) Model 2 stress fibers were incubated first with 0 (lanes 1 and 4), 1.0 (lanes 2 and 5), or 10 (lanes 3 and 6) μg/ml HA1077 and then with radio-labeled ATP in the absence (lanes 1–3) or presence (lanes 4–6) of Ca2+. Without Ca2+, Rho-kinase but not MLCK can phosphorylate MLC, and this phosphorylation was completely inhibited by 10 μg/ml HA1077 (lane 3). However, when Ca2+ is present, both Rho-kinase and MLCK can phosphorylate MLC and the Rho-kinase inhibitor cannot inhibit MLC phosphorylation (lanes 4–6). Model 1 stress fibers were first incubated with both 5.1 μg/ml dominant-active Rho-kinase and 0 (lane 7), 1.0 (lane 8), or 10 (lane 9) μg/ml HA1077 and then with radio-labeled ATP in the absence of Ca2+. Rho-kinase–dependent MLC phosphorylation is demonstrated. In all of these cases, stress fiber contraction was observed when MLC phosphorylation was unequivocally detected by autoradiography. (a and b) 20 μg of protein was loaded in each lane. (c–f) 10 μg of protein was loaded in each lane. (d) ±, the limited extent of contraction.
Figure 8
Figure 8
Rho-kinase and MLCK-dependent contraction of isolated stress fibers. (a) Stress fiber contraction by activating both Rho-kinase and MLCK (•), MLCK alone (○), or Rho-kinase alone (▵). For details, refer to Results. The stress fiber length change expressed as a percentage of the original length was plotted against time. When both kinases were active, faster and more extensive contraction was observed. MLCK initiates contraction faster than does Rho-kinase. The values shown are means ± SE of 10 individual isolated stress fibers. (b) Time courses of the MLC phosphorylation by both Rho-kinase and MLCK, MLCK alone, and Rho-kinase alone. Phosphorylation levels were determined by autoradiography at 0, 30, 60, 120, 180 s after the addition of radio-labeled ATP. Freshly isolated stress fibers were incubated for 180 s with Ca2+-free Mg-ATP as a control. MLC phosphorylation was comparable to the level seen at time 0 of each experiment. 20 μg of protein was loaded in each lane. (c) Quantitative presentation of MLC phosphorylation under different conditions. The autoradiography bands were quantified by densitometry. The density of the band at time 0 was recorded as 1 for each series, and all the data are expressed relative to this value. The values shown are means ± SE of four independent experiments.
Figure 10
Figure 10
Two regulatory systems for actomyosin contraction in nonmuscle cells. P-MLC is phosphorylated MLC, which induces actomyosin-based contraction.
Figure 9
Figure 9
Effects of a Rho-kinase inhibitor, Y-27632, on living fibroblasts expressing GFP–actin. Control (a) and Y-27632–treated (10 μM) (b) fibroblasts that were not transfected with GFP–actin were stained doubly with rhodamine–phalloidin (red) and antivinculin (green). Yellow indicates colocalization of these proteins. Cells treated with the inhibitor had very few, if any, stress fibers and focal adhesions. Note the lacy appearance of the cytoplasm in the treated cells. Fibroblasts expressing GFP–actin were incubated with Y-27632, and time-lapse images were obtained by confocal laser scanning microscopy (c and d). After 1 h of incubation (d), the number and intensity of stress fibers decreased and the arches areas of the cell often disappeared (compare the boxed area in c with that of d; arrows). Nuclear relocation was also observed (the dotted line indicates the position of the nucleus before Y-27632 treatment). The boxed area in c is enlarged, and the sequence of morphological changes observed in this area is illustrated in e. Note that with time, stress fibers and arches (arrowheads) disappear. After 1 h of incubation with the Rho-kinase inhibitor, cells were washed with fresh culture medium and their recovery process was recorded (f). Both stress fibers and arches (arrowheads) reformed. These morphological changes observed in Y-27632–treated cells were not seen in cells treated with ML-7, an MLCK inhibitor (g). N, nucleus. Numbers in e–g indicate time in min.

References

    1. Alessi D., MacDougall L.K., Sola M.M., Ikebe M., Cohen P. The control of protein phosphatase-1 by targeting subunits. The major myosin phosphatase in avian smooth muscle is a novel form of protein phosphatase-1. Eur. J. Biochem. 1992;210:1023–1035. - PubMed
    1. Amano M., Ito M., Kimura K., Fukata Y., Chihara K., Nakano T., Matsuura Y., Kaibuchi K. Phosphorylation and activation of myosin by Rho-associated kinase (Rho-kinase) J. Biol. Chem. 271 1996. 20246 20249a - PubMed
    1. Amano M., Mukai H., Ono Y., Chihara K., Matsui T., Hamajima Y., Okawa K., Iwamatsu A., Kaibuchi K. Identification of a putative target for Rho as the serine-threonin kinase protein kinase N Science 271 1996. 648 650b - PubMed
    1. Amano M., Chihara K., Kimura K., Fukata Y., Nakamura N., Matsuura Y., Kaibuchi K. Formation of actin stress fibers and focal adhesions enhanced by Rho-kinase. Science. 1997;275:1308–1311. - PubMed
    1. Amano M., Chihara K., Nakamura N., Fukata Y., Yano T., Shibata M., Ikebe M., Kaibuchi K. Myosin II activation promotes neurite retraction during the action of Rho and Rho-kinase. Genes Cells. 1998;3:177–188. - PubMed

Publication types

MeSH terms