Kinetics of inward-rectifier K+ channel block by quaternary alkylammonium ions. dimension and properties of the inner pore
- PMID: 11331349
- PMCID: PMC2233664
- DOI: 10.1085/jgp.117.5.395
Kinetics of inward-rectifier K+ channel block by quaternary alkylammonium ions. dimension and properties of the inner pore
Abstract
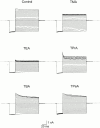
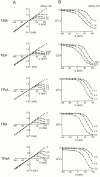
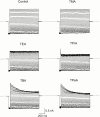
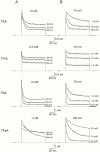
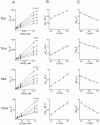
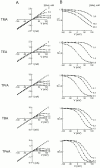
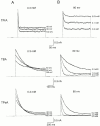
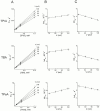
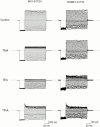
We examined block of two inward-rectifier K+ channels, IRK1 and ROMK1, by a series of intracellular symmetric quaternary alkylammonium ions (QAs) whose side chains contain one to five methylene groups. As shown previously, the ROMK1 channels bind larger QAs with higher affinity. In contrast, the IRK1 channels strongly select TEA over smaller or larger QAs. This remarkable difference in QA selectivity between the two channels results primarily from differing QA unbinding kinetics. The apparent rate constant for binding (kon) of all examined QAs is significantly smaller than expected for a diffusion-limited process. Furthermore, a large ( approximately 30-fold) drop in kon occurs when the number of methylene groups in QAs increases from three to four. These observations argue that between the intracellular solution and the QA-binding locus, there exists a constricted pathway, whose dimension ( approximately 9 A) is comparable to that of a K+ ion with a single H2O shell.
Figures




Similar articles
-
Evidence for sequential ion-binding loci along the inner pore of the IRK1 inward-rectifier K+ channel.J Gen Physiol. 2005 Aug;126(2):123-35. doi: 10.1085/jgp.200509296. J Gen Physiol. 2005. PMID: 16043774 Free PMC article.
-
Interaction between quaternary ammonium ions in the pore of potassium channels. Evidence against an electrostatic repulsion mechanism.J Gen Physiol. 2000 Jun;115(6):769-82. doi: 10.1085/jgp.115.6.769. J Gen Physiol. 2000. PMID: 10828250 Free PMC article.
-
Mechanism of IRK1 channel block by intracellular polyamines.J Gen Physiol. 2000 Jun;115(6):799-814. doi: 10.1085/jgp.115.6.799. J Gen Physiol. 2000. PMID: 10828252 Free PMC article.
-
Functional identification of ion binding sites at the internal end of the pore in Shaker K+ channels.J Physiol. 2003 May 15;549(Pt 1):107-20. doi: 10.1113/jphysiol.2002.038646. Epub 2003 Mar 28. J Physiol. 2003. PMID: 12665608 Free PMC article.
-
Recent advances on renal inward rectifier K+ channels.Curr Opin Nephrol Hypertens. 1998 Sep;7(5):503-8. doi: 10.1097/00041552-199809000-00004. Curr Opin Nephrol Hypertens. 1998. PMID: 9818196 Review.
Cited by
-
The Kir channel immunoglobulin domain is essential for Kir1.1 (ROMK) thermodynamic stability, trafficking and gating.Channels (Austin). 2009 Jan-Feb;3(1):57-68. doi: 10.4161/chan.3.1.7817. Epub 2009 Jan 6. Channels (Austin). 2009. PMID: 19221509 Free PMC article.
-
Crystal structure of the eukaryotic strong inward-rectifier K+ channel Kir2.2 at 3.1 A resolution.Science. 2009 Dec 18;326(5960):1668-74. doi: 10.1126/science.1180310. Science. 2009. PMID: 20019282 Free PMC article.
-
Mechanism of the voltage sensitivity of IRK1 inward-rectifier K+ channel block by the polyamine spermine.J Gen Physiol. 2005 Apr;125(4):413-26. doi: 10.1085/jgp.200409242. Epub 2005 Mar 14. J Gen Physiol. 2005. PMID: 15795311 Free PMC article.
-
Calcium ions open a selectivity filter gate during activation of the MthK potassium channel.Nat Commun. 2015 Sep 23;6:8342. doi: 10.1038/ncomms9342. Nat Commun. 2015. PMID: 26395539 Free PMC article.
-
Characterizing the fatty acid binding site in the cavity of potassium channel KcsA.Biochemistry. 2012 Oct 9;51(40):7996-8002. doi: 10.1021/bi3009196. Epub 2012 Sep 25. Biochemistry. 2012. PMID: 22971149 Free PMC article.
References
-
- Choi K.L., Mossman C., Aube J., Yellen G. The internal quaternary ammonium receptor site of Shaker potassium channels. Neuron. 1993;10:533–541. - PubMed
Publication types
MeSH terms
Substances
Grants and funding
LinkOut - more resources
Full Text Sources
Other Literature Sources
Research Materials

