. 2001 May;117(5):491-504.
doi: 10.1085/jgp.117.5.491.

Properties of hyperpolarization-activated pacemaker current defined by coassembly of HCN1 and HCN2 subunits and basal modulation by cyclic nucleotide

Affiliations

Properties of hyperpolarization-activated pacemaker current defined by coassembly of HCN1 and HCN2 subunits and basal modulation by cyclic nucleotide

S Chen et al. J Gen Physiol. 2001 May.

Abstract

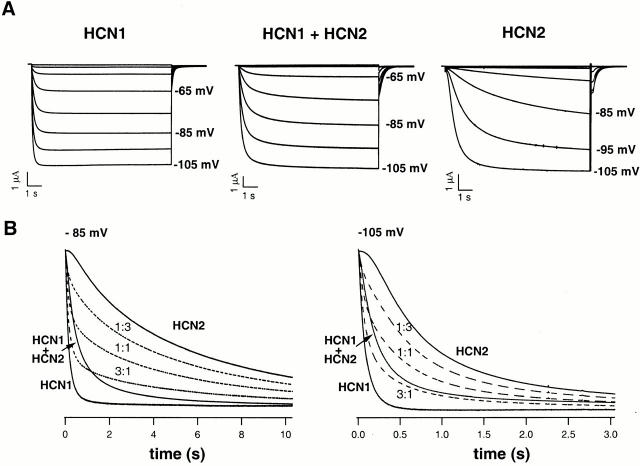
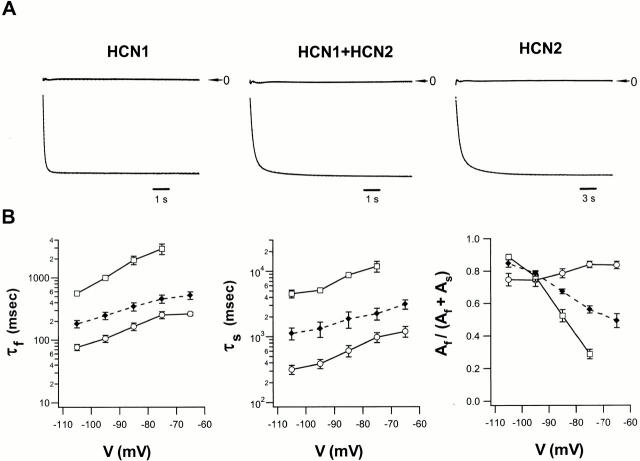
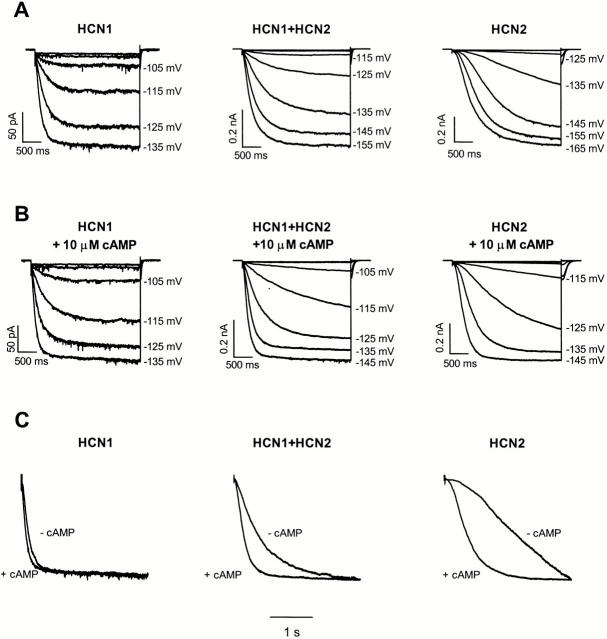
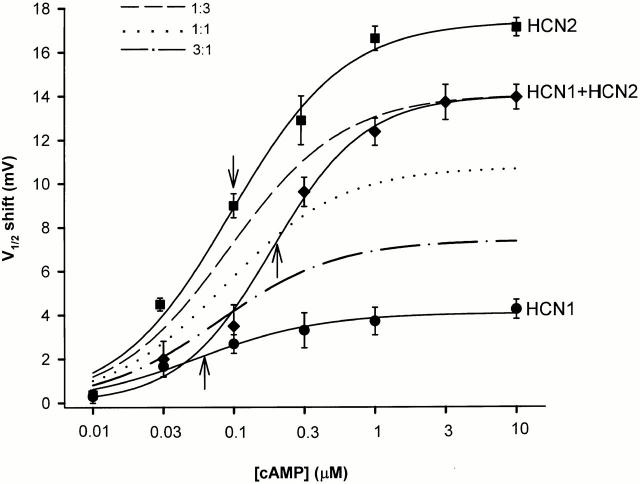
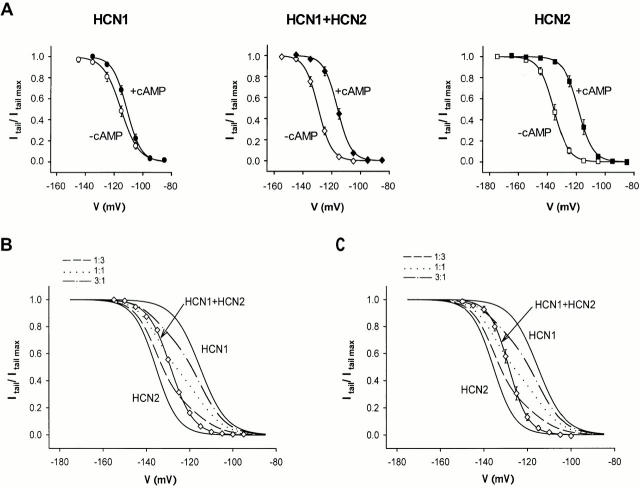
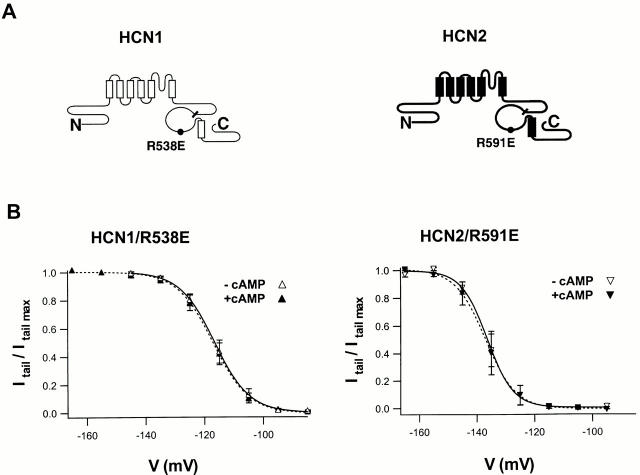
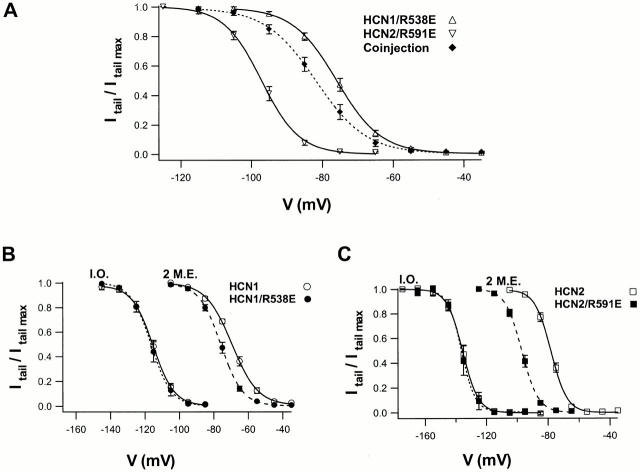
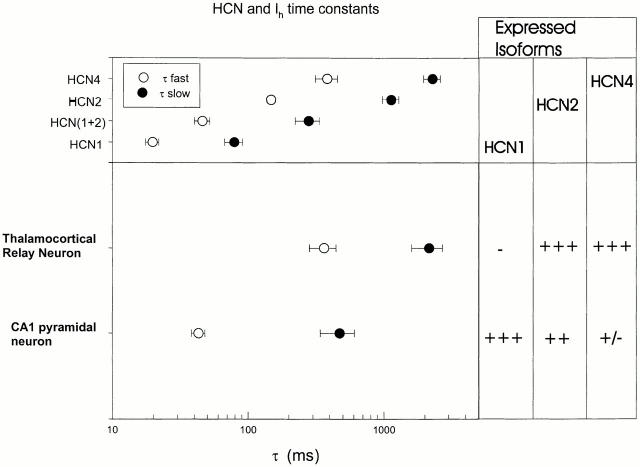
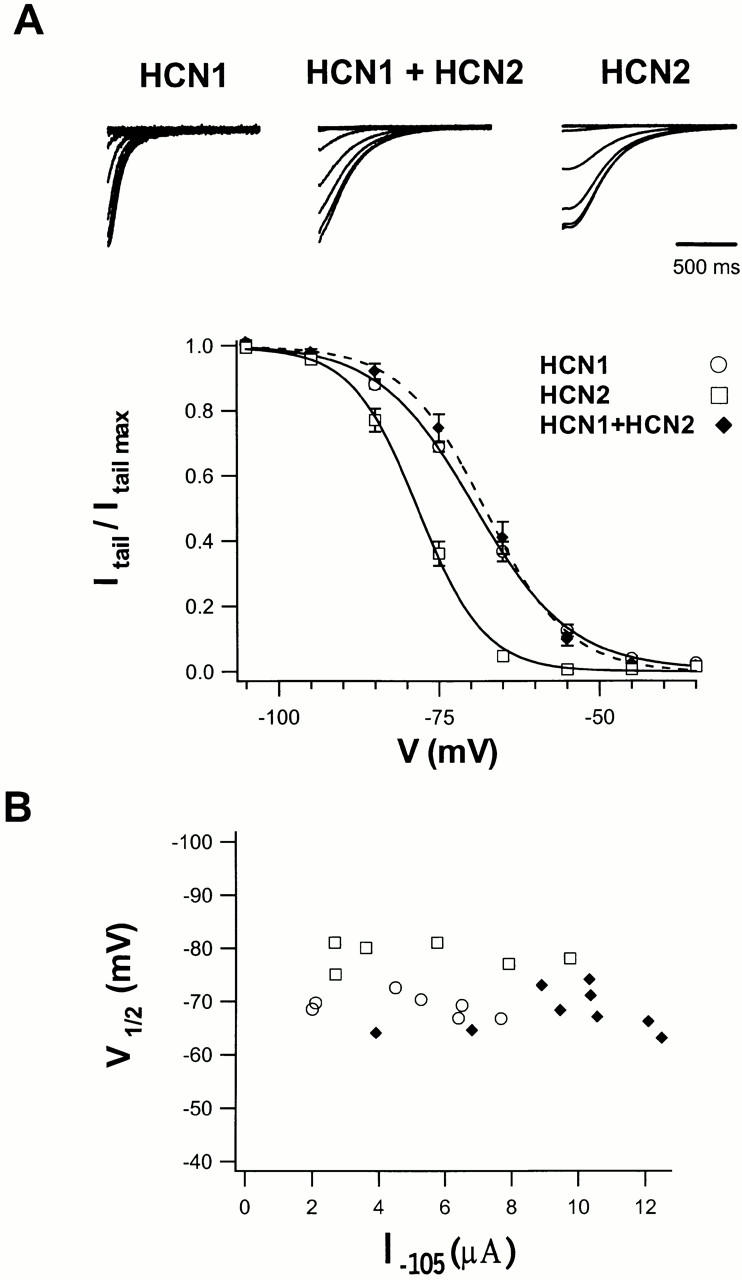
Members of the HCN channel family generate hyperpolarization-activated cation currents (Ih) that are directly regulated by cAMP and contribute to pacemaker activity in heart and brain. The four HCN isoforms show distinct but overlapping patterns of expression in different tissues. Here, we report that HCN1 and HCN2, isoforms coexpressed in neocortex and hippocampus that differ markedly in their biophysical properties, coassemble to generate heteromultimeric channels with novel properties. When expressed in Xenopus oocytes, HCN1 channels activate 5-10-fold more rapidly than HCN2 channels. HCN1 channels also activate at voltages that are 10-20 mV more positive than those required to activate HCN2. In cell-free patches, the steady-state activation curve of HCN1 channels shows a minimal shift in response to cAMP (+4 mV), whereas that of HCN2 channels shows a pronounced shift (+17 mV). Coexpression of HCN1 and HCN2 yields Ih currents that activate with kinetics and a voltage dependence that tend to be intermediate between those of HCN1 and HCN2 homomers, although the coexpressed channels do show a relatively large shift by cAMP (+14 mV). Neither the kinetics, steady-state voltage dependence, nor cAMP dose-response curve for the coexpressed Ih can be reproduced by the linear sum of independent populations of HCN1 and HCN2 homomers. These results are most simply explained by the formation of heteromeric channels with novel properties. The properties of these heteromeric channels closely resemble the properties of I(h) in hippocampal CA1 pyramidal neurons, cells that coexpress HCN1 and HCN2. Finally, differences in Ih channel properties recorded in cell-free patches versus intact oocytes are shown to be due, in part, to modulation of Ih by basal levels of cAMP in intact cells.


Figures

Figure 1
Figure 1
Coexpression of HCN1 and HCN2 results in currents recorded from intact oocytes with novel kinetics that cannot be accounted for by expression of two independent populations of homomeric HCN channels. (A) Currents recorded by two microelectrode voltage clamp elicited by 10-s hyperpolarizations in oocytes injected with cRNA of either HCN1 (left), HCN2 (right) alone, or with a 1:1 mixture of HCN1 and HCN2 (HCN1 + HCN2) (middle). Holding potential was −30 mV, and the voltage was stepped to negative potentials from −35 mV in 10-mV increments to −105 mV. Tail currents were measured at −40 mV. (B) Current traces elicited by 30-s pulses to −85 mV (bottom left) or 10-s pulses to −105 mV (bottom right) from oocytes injected with HCN1 alone, HCN2 alone, or 1:1 mixture of HCN1 and HCN2 (HCN1 + HCN2). Solid traces show normalized averaged currents from several oocytes injected with given composition of RNA. Dashed traces show algebraic sums of HCN1 and HCN2 averaged currents in ratios of 1:3, 1:1, and 3:1 (HCN1/HCN2 ratio). Four to five separate experiments (oocytes) averaged for each recording trace.
Figure 2
Figure 2
Activation kinetics for HCN1, HCN2, and coexpressed subunits from intact oocytes. (A) Ih currents during hyperpolarizing steps to −105 mV with superimposed fit of sum of two exponential functions (bottom traces) with residuals showing difference between data and fit (top traces). (left) HCN1 alone (10-s step); (middle) HCN1 + HCN2 (10-s step); and (right) HCN2 alone (30-s step). (B) Plot of two exponential constants as function of voltage. (left) Voltage dependence of fast exponential time constant (τf). (middle) Voltage dependence of slow exponential time constant (τs). (right) Relative amplitude of fast exponential component as function of voltage, Af/(Af + As), where Af and As are the amplitudes of the fast and slow exponential components, respectively. (open circles) HCN1; (open squares) HCN2; (closed diamonds) HCN1 + HCN2.
Figure 4
Figure 4
Coexpression of HCN1 and HCN2 gives rise to a distinct Ih phenotype in inside-out patches. (A) Currents elicited by 3-s hyperpolarizations in patches obtained from oocytes injected with cRNA of either HCN1 alone (left), HCN2 alone (right), or with a 1:1 mixture of HCN1 and HCN2 (HCN1 + HCN2) (middle). Patches were stepped to voltages ranging from −85 to −165 mV in 10-mV steps from a holding potential of −40 mV. (B) Effect of cAMP on channel activation. Currents shown for same patches with same protocols as in A, but in the presence of 10 μM cAMP. (c) Activation kinetics during a step to −135 mV in the presence and absence of 10 μM cAMP. Superimposed traces shown in A and B were scaled so amplitudes were equaled.
Figure 6
Figure 6
Coexpression of HCN1 and HCN2 generates channels with a novel cAMP dose–response relation. Mean dose–response curves for shifts in V1/2 as a function of cAMP concentration for HCN1 (closed circles, 26 patches), HCN2 (closed squares, 16 patches), and coexpression of HCN1 and HCN2 (closed diamonds, 31 patches). Solid lines show fit of the Hill equation (see materials and methods). The positions of the K1/2 values are indicated by arrows. Dash, dotted, and dash-dotted lines: linear sums of HCN1 and HCN2 dose–response curves at 1:3, 1:1, 3:1 (HCN1/HCN2) ratios.
Figure 5
Figure 5
Steady-state activation curves determined in inside-out patches in the presence and absence of cAMP. (A) Average tail current activation curves for HCN1, HCN2, and coexpression of HCN1 and HCN2 in the presence (closed symbols) and absence (open symbols) of 10 μM cAMP. (left) HCN1 (7 patches); (middle) coexpression of HCN1 and HCN2 (9 patches); (right) HCN2 (10 patches). Solid lines show fit of Boltzmann relation. (B) The activation curve of Ih current generated by coexpression of HCN1 and HCN2 from a representative patch cannot be reproduced by linear sums of average HCN1 and HCN2 activation curves obtained from A. (solid lines) HCN2, HCN1 + HCN2 (open diamonds), and HCN1 from left to right. Dashed, dotted, and dash-dotted lines: linear sums of HCN1 and HCN2 activation curves at 1:3, 1:1, 3:1 (HCN1/HCN2) ratios. (C) The average Boltzmann activation curve for Ih currents generated by coexpression of HCN1 and HCN2 (open diamonds, 7 patches) cannot be reproduced by linear sums of average HCN1 and HCN2 activation curves. Bars indicate SEM.
Figure 7
Figure 7
Mutation of a conserved arginine residue in the CNBD to glutamate prevents cAMP binding, but has no effect on the channel's intrinsic voltage dependence. (A) Diagram showing the site of the mutation. HCN1 and HCN2 are shown as six transmembrane helices (rectangles) with the P-loop connecting the fifth and sixth helices. The CNBD, located in the cytoplasmic COOH terminus, starts at the hash mark and ends at the last rectangle. It is depicted as a loop, representing the β-roll, and a rectangle, representing the C α-helix. (B) Steady-state tail current activation curves obtained in inside-out patches using 3-s hyperpolarizing steps for HCN1/R538E (left) and HCN2/R591E (right) channels. (open symbols) Data in absence of cAMP. (closed symbols) Data in presence of 10 μM cAMP. Solid and dashed curves show fits of Boltzmann relation in absence and presence of cAMP, respectively (see Table for values).
Figure 8
Figure 8
Comparison of effects of the arginine to glutamate point mutation on HCN channels in inside-out patches versus intact oocytes. (A) Mean steady-state tail current activation curves in intact oocytes using two microelectrode voltage clamp for HCN1/R538E channels (triangles), HCN2/R591E channels (inverted triangles), or channels formed upon coinjection of the two mutant subunits (closed symbol). Tail currents obtained after 10-s hyperpolarizing steps. (B and C), Comparisons of steady-state activation curves for wild-type (open symbols) versus mutant (closed symbols) HCN1 (B) or HCN2 (C) subunits in inside-out patches (I.O.) and intact oocytes studied with two microelectrode voltage-clamp (2 M.E.). Solid and dashed lines show fits of Boltzmann relation to wild-type and mutant subunits, respectively.
Figure 9
Figure 9
Comparison of recombinant and native Ih activation time constants. Fast (τfast) and slow (τslow) exponential time constants during activation of Ih for hyperpolarizing steps to −105 mV. Native Ih time constants shown for thalamocortical relay neurons and hippocampal CA1 pyramidal cells from data in Santoro et al. 2000. Relative mRNA expression levels for HCN isoforms from in situ hybridization in corresponding tissues also from Santoro et al. 2000. Data for recombinant HCN1, HCN2, and coexpression of HCN1 + HCN2 from our present study. Time constants normalized to 34°C assuming a Q10 of 4 (DiFrancesco 1993). Data for rabbit HCN4 taken from Ishii et al. 1999.
Figure 3
Figure 3
Steady-state activation curves for HCN1, HCN2, and coexpressed channels in intact oocytes. (A, top) Tail currents of either HCN1 alone, HCN2 alone, or coinjected HCN1 and HCN2. (bottom) Averaged, normalized steady-state tail current activation curves were obtained using 10-s hyperpolarizing steps for HCN1 currents (open circles, 8 cells) and currents produced by coexpression of HCN1 and HCN2 (closed diamonds, 9 cells); 30-s hyperpolarizing steps were used for HCN2 currents (open squares, 8 cells). Curves show fit of Boltzmann relations (see materials and methods for details). Bars show SEM. (B) Relation of steady-state V1/2 and Ih current amplitude at the end of 3-s hyperpolarizing step to −105 mV. Each symbol shows data recorded for an individual oocyte injected with HCN1 (open circles), HCN2 (open squares), or HCN1 + HCN2 (closed diamonds).

Similar articles

Cited by

References

    1. Bader C.R., Macleish P.R., Schwartz E.A. A voltage-clamp study of the light response in solitary rods of the tiger salamander. J. Physiol. 1979;296:1–26. - PMC - PubMed
    1. Beaumont V., Zucker R.S. Enhancement of synaptic transmission by cyclic AMP modulation of presynaptic Ih channels. Nat. Neurosci. 2000;3:133–141. - PubMed
    1. Brown H., DiFrancesco D. Voltage-clamp investigations of membrane currents underlying pace-maker activity in rabbit sino-atrial node. J. Physiol. 1980;308:331–351. - PMC - PubMed
    1. Brown H.F., DiFrancesco D., Noble S.J. How does adrenaline accelerate the heart? Nature. 1979;280:235–236. - PubMed
    1. Demontis G.C., Longoni B., Barcaro U., Cervetto L. Properties and functional roles of hyperpolarization-gated currents in guinea-pig retinal rods. J. Physiol. 1999;515:813–828. - PMC - PubMed

Publication types

MeSH terms