

Complex trait analysis of the hippocampus: mapping and biometric analysis of two novel gene loci with specific effects on hippocampal structure in mice
- PMID: 11331379
- PMCID: PMC6762463
- DOI: 10.1523/JNEUROSCI.21-10-03503.2001
Complex trait analysis of the hippocampus: mapping and biometric analysis of two novel gene loci with specific effects on hippocampal structure in mice
Abstract
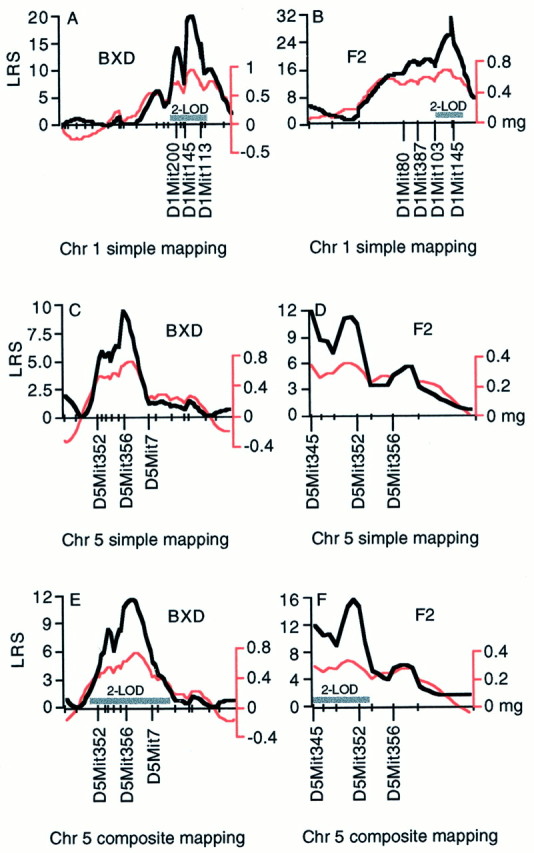
Notable differences in hippocampal structure are associated with intriguing differences in development and behavioral capabilities. We explored genetic and environmental factors that modulate hippocampal size, structure, and cell number using sets of C57BL/6J (B6) and DBA/2J (D2) mice; their F1 and F2 intercrosses (n = 180); and 35 lines of BXD recombinant inbred (RI) strains. Hippocampal weights of the parental strains differ by 20%. Estimates of granule cell number also differ by approximately 20%. Hippocampal weights of RI strains range from 21 to 31 mg, and those of individual F2 mice range from 23 to 36 mg (bilateral weights). Volume and granule cell number are well correlated (r = 0.7-0.8). Significant variation is associated with differences in age and sex. The hippocampus increases in weight by 0.24 mg per month, and those of males are 0.55 mg heavier (bilateral) than those of females. Heritability of variation is approximately 50%, and half of this genetic variation is generated by two quantitative trait loci that map to chromosome 1 (Hipp1a: genome-wide p < 0.005, between 65 and 100 cM) and to chromosome 5 (Hipp5a, p < 0.05, between 15 and 40 cM). These are among the first gene loci known to produce normal variation in forebrain structure. Hipp1a and Hipp5a individually modulate hippocampal weight by 1.0-2.0 mg, an effect size greater than that generated by age or sex. The Hipp gene loci modulate neuron number in the dentate gyrus, collectively shifting the population up or down by as much as 200,000 cells. Candidate genes for the Hipp loci include Rxrg and Fgfr3.
Figures


Similar articles
-
Genetic control of the mouse cerebellum: identification of quantitative trait loci modulating size and architecture.J Neurosci. 2001 Jul 15;21(14):5099-109. doi: 10.1523/JNEUROSCI.21-14-05099.2001. J Neurosci. 2001. PMID: 11438585 Free PMC article.
-
Genetic architecture of the mouse hippocampus: identification of gene loci with selective regional effects.Genes Brain Behav. 2003 Aug;2(4):238-52. doi: 10.1034/j.1601-183x.2003.00030.x. Genes Brain Behav. 2003. PMID: 12953790
-
Genetic dissection of the olfactory bulbs of mice: QTLs on four chromosomes modulate bulb size.Behav Genet. 2001 Jan;31(1):61-77. doi: 10.1023/a:1010209925783. Behav Genet. 2001. PMID: 11529276
-
Use of recombinant inbred strains for studying genetic determinants of responses to alcohol.Alcohol Alcohol Suppl. 1994;2:67-71. Alcohol Alcohol Suppl. 1994. PMID: 8974318 Review.
-
Quantitative trait loci (QTLs) mapping for growth traits in the mouse: a review.Genet Sel Evol. 2001 Mar-Apr;33(2):105-32. doi: 10.1186/1297-9686-33-2-105. Genet Sel Evol. 2001. PMID: 11333830 Free PMC article. Review.
Cited by
-
Nicotinic acetylcholine receptor expression in the hippocampus of 27 mouse strains reveals novel inhibitory circuitry.Hippocampus. 2008;18(8):737-49. doi: 10.1002/hipo.20430. Hippocampus. 2008. PMID: 18446824 Free PMC article.
-
Variation in the cortical area map of C57BL/6J and DBA/2J inbred mice predicts strain identity.BMC Neurosci. 2005 Mar 17;6:18. doi: 10.1186/1471-2202-6-18. BMC Neurosci. 2005. PMID: 15774010 Free PMC article.
-
Post-transcriptional regulation of mouse neurogenesis by Pumilio proteins.Genes Dev. 2017 Jul 1;31(13):1354-1369. doi: 10.1101/gad.298752.117. Epub 2017 Aug 9. Genes Dev. 2017. PMID: 28794184 Free PMC article.
-
Genome Reshuffling for Advanced Intercross Permutation (GRAIP): simulation and permutation for advanced intercross population analysis.PLoS One. 2008 Apr 23;3(4):e1977. doi: 10.1371/journal.pone.0001977. PLoS One. 2008. PMID: 18431467 Free PMC article.
-
Genetic control of the mouse cerebellum: identification of quantitative trait loci modulating size and architecture.J Neurosci. 2001 Jul 15;21(14):5099-109. doi: 10.1523/JNEUROSCI.21-14-05099.2001. J Neurosci. 2001. PMID: 11438585 Free PMC article.
References
-
- Abusaad I, MacKay D, Zhao J, Stanford P, Collier DA, Everall IP. Stereological estimation of the total number of neurons in the murine hippocampus using the optical disector. J Comp Neurol. 1999;408:560–566. - PubMed
-
- Altman J, Das GD. Autoradiographic and histological evidence of postnatal hippocampal neurogenesis in rats. J Comp Neurol. 1965;124:319–335. - PubMed
-
- Asai T, Wanaka A, Kato H, Masana Y, Seo M, Tohyama M. Differential expression of two members of FGF receptor gene family, FGFR-1 and FGFR-2 mRNA, in the adult rat central nervous system. Brain Res Mol Brain Res. 1993;17:174–178. - PubMed
-
- Barber RP, Vaughn JE, Wimer RE, Wimer CC. Genetically-associated variations in the distribution of dentate granule cell synapses upon the pyramidal cell dendrites in mouse hippocampus. J Comp Neurol. 1974;156:417–434. - PubMed
Publication types
MeSH terms
Grants and funding
LinkOut - more resources
Full Text Sources
Molecular Biology Databases
Miscellaneous