. 2001 May 15;21(10):3580-92.
doi: 10.1523/JNEUROSCI.21-10-03580.2001.

Layer-specific intracolumnar and transcolumnar functional connectivity of layer V pyramidal cells in rat barrel cortex

Affiliations

Layer-specific intracolumnar and transcolumnar functional connectivity of layer V pyramidal cells in rat barrel cortex

D Schubert et al. J Neurosci. .

Abstract

Layer V pyramidal cells in rat barrel cortex are considered to play an important role in intracolumnar and transcolumnar signal processing. However, the precise circuitry mediating this processing is still incompletely understood. Here we obtained detailed maps of excitatory and inhibitory synaptic inputs onto the two major layer V pyramidal cell subtypes, intrinsically burst spiking (IB) and regular spiking (RS) cells, using a combination of caged glutamate photolysis, whole-cell patch-clamp recording, and three-dimensional reconstruction of biocytin-labeled cells. To excite presynaptic neurons with laminar specificity, the release of caged glutamate was calibrated and restricted to small areas of 50 x 50 microm in all cortical layers and in at least two neighboring barrel-related columns. IB cells received intracolumnar excitatory input from all layers, with the largest EPSP amplitudes originating from neurons in layers IV and VI. Prominent transcolumnar excitatory inputs were provided by presynaptic neurons also located in layers IV, V, and VI of neighboring columns. Inhibitory inputs were rare. In contrast, RS cells received distinct intracolumnar inhibitory inputs, especially from layers II/III and V. Intracolumnar excitatory inputs to RS cells were prominent from layers II-V, but relatively weak from layer VI. Conspicuous transcolumnar excitatory inputs could be evoked solely in layers IV and V. Our results show that layer V pyramidal cells are synaptically driven by presynaptic neurons located in every layer of the barrel cortex. RS cells seem to be preferentially involved in intracolumnar signal processing, whereas IB cells effectively integrate excitatory inputs across several columns.


Figures

Fig. 1.
Fig. 1.
Photomicrograph taken directly after an experiment of a living unstained coronal slice of the somatosensory cortex with positioned electrodes. The tip of the patch electrode points at a pyramidal cell in layer V (position marked by a gray triangle). The bipolar stimulation electrode is placed in the white matter (wm) for electrical stimulation of the afferents. The grid superimposed on the micrograph indicates the relative location and the extent of the area typically used for investigating the functional connectivity of layer V pyramidal cells. Fields (450) 50 × 50 μm in size were stimulated in sequence at 10 sec intervals covering all cortical layers and at least two barrel-related columns. The two barrels in layer IV located within the investigated area are outlined by white lines. Roman numerals indicate cortical layers.
Fig. 2.
Fig. 2.
Action potential firing pattern (AC) and synaptic responses (D, E) of layer V pyramidal cells.A, Response of an intrinsically burst spiking cell (IB cell) to injection of a suprathreshold depolarizing current pulse at resting membrane potential. The initial burst consists of an action potential followed by a DAP with three spikes of decreasing amplitude. The initial burst is followed by a sequence of single APs.B, In the doublet spiking cell, the intracellular current pulse elicits an initial action potential followed by a small DAP with one spike and subsequent single APs with no spike-frequency adaptation. C, In the regular spiking cell (RS cell), the depolarizing current evokes a train of single APs without any DAP.D, Postsynaptic responses of an IB cell to strong orthodromic stimulation (2× threshold; arrow) at different membrane potentials. The stimulus evokes a burst and a long lasting EPSP. E, Orthodromic synaptic stimulation of the RS cell elicits a single spike and an EPSP truncated by a fast (*) and a slow (**) IPSP.
Fig. 3.
Fig. 3.
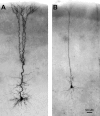
Photoreconstructions of a biocytin-stained intrinsically burst spiking cell (A) and a regular spiking cell (B) in a 300-μm-thick coronal section of the barrel cortex. A, The IB cell shows a large soma and a thick apical dendrite, which gives off oblique collateral branches in layer V and bifurcates in layer IV, giving rise to a rich terminal tuft. The basal dendrites are also extensively ramified. B, The RS cell shows a smaller soma and a thinner apical dendrite. The apical dendritic tree as well as the basal dendrites are ramified less extensively.
Fig. 4.
Fig. 4.
Repetitive stimulation of proximal apical dendritic (A, B) and perisomatic (C, D) fields of an IB (A,C) and an RS cell (B, D) via localized release of caged glutamate. The bathing medium contained 0.2 mm Ca2+ and 4 mmMg2+ to block synaptic transmission.Inset, Schematic diagram of a pyramidal cell and relative positions of the stimulated areas. A,B, Photolysis of caged glutamate in 50 × 50 μm large fields positioned ∼150 μm away from the soma of the recorded cells and (C, D) on the apical dendrite close to the soma. Repetitive stimulation at 10 sec intervals reliably induces a membrane depolarization, which only during perisomatic stimulation triggers a burst (C) or a single action potential (D). Twenty subsequent traces are superimposed to illustrate the stability of the responses to caged glutamate photolysis. The recordings were performed at resting membrane potential of −62 mV in the IB cell and −68 mV in the RS cell.
Fig. 5.
Fig. 5.
Properties of repetitively evoked activity in bathing solution containing low Ca2+/high Mg2+. In an area of 50 × 50 μm located on the apical dendrite ∼150 μm away from the soma, caged glutamate was photolyzed 20 times at 10 sec intervals at resting membrane potential. Data are normalized to the first response and are presented as mean ± SD (AC: n = 3 RS cells and 3 IB cells; D: n = 2 RS cells and 2 IB cells). A, Delay-to- onset of activation times.B, Rise-times (20–80%) of the responses.C, Amplitudes of the elicited depolarizations.D, Delay between stimulation and action potential threshold (action potential latency) varied between 80 and 120% of the initial control value.
Fig. 6.
Fig. 6.
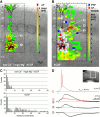
Topographic maps of depolarization amplitude and delay-to-onset of activation times of an IB cell in low Ca2+/high Mg2+-containing solution. The photomicrograph of the native slice was superimposed on the respective Neurolucida reconstruction of the somatodendritic domains of the IB cell and the map illustrating the amplitudes of induced activity (A) or the delay-to-onset of activation (B). The size of the investigated area is outlined in black. Stimulated fields without any correlated activity are transparent. The colors indicate the depolarization amplitudes, action potentials, or delay-to-onset times (see color scale). The positions of the stimulated fields corresponding to the traces in D are marked1-3. A, In low Ca2+/high Mg2+ ACSF, activity can be evoked only by stimulation of fields containing dendritic extensions of the IB cell. Photolysis induces action potentials in perisomatic fields only. B, The delay-to-onset times correlate with the distance of the stimulation site to the soma. Perisomatic stimulation leads almost instantly to an activity (<0.2 msec), whereas activity evoked by stimulation near the pial surface reaches the soma after >5 msec. C, Current–voltage relationship identifies the recorded cell as an IB cell. Inset, Photo of the native slice marking the sector presented in Aand B (outlined in white).D, Responses to photolysis of caged glutamate at positions indicated in A and B. With increasing distance from the soma, depolarization amplitudes decrease, whereas the delay-to-onset times increase. Fast suprathreshold depolarization inducing a burst of APs is elicited at stimulation site3 at the soma. E, Correlation between delay-to-onset times and distance of the stimulation site to the soma for three RS cells and three IB cells. Data were used to calculate an electrotonic propagation velocity of 0.26 m/sec (red line, r = 0.967).
Fig. 7.
Fig. 7.
Repetitive postsynaptic responses recorded in normal ACSF in an RS cell (Vrmp = −64 mV). Fields1 and 2 containing no dendritic extensions of the recorded cell were stimulated 20 times at 10 sec intervals. A perisomatic field was stimulated 10 times (field3). The left column shows a representative single response of the superimposed traces recorded from the RS cell. A, Stimulation of field 1induces a reliable inhibitory input onto the RS cell without any failures. B, Stimulation of field 2induces excitatory inputs onto the RS cell. C, The perisomatic stimulation (field 3) reliably induces a suprathreshold depolarization. The AP latencies vary between 15 and 25 msec.
Fig. 8.
Fig. 8.
Properties of excitatory inputs onto layer V pyramidal cells. Excitatory inputs onto an IB cell (Vrmp = −72 mV) induced by repetitive stimulation (15×, 10 sec intervals) of a field located in layer VI ∼250 μm from the soma. The stimulation induced two distinct EPSPs with an average amplitude of 2.9 ± 0.2 mV (EPSP1) and 1.3 ± 0.2 mV (EPSP2). Superimposed traces (A1) and selected single traces (A2, A3) demonstrate the large variability in the delay-to-onset times of EPSP1 and EPSP2.B, Variability of the delay-to-onset times. Failure rate is 17% for EPSP1 and 33% for EPSP2. Plot of the relationship between EPSP amplitude and integral (C) and plot of the relationship between EPSP amplitude and rise-time (D) demonstrate that both populations of EPSPs can be clearly differentiated.
Fig. 9.
Fig. 9.
Topographic maps of uncaged glutamate-induced activity during blockade of synaptic transmission (A) and in normal bathing solution (B). A, Color-coded map of the amplitudes of depolarizations evoked by direct dendritic activation recorded at resting membrane potential (Vrmp = −69 mV) in bathing solution containing 0.2 mm Ca2+/4 mmMg2+. Fields eliciting an action potential are marked in red. B, Responses recorded in normal ACSF at a depolarized membrane potential (Vhold = −60 mV) consist of IPSPs (blue), action potentials (red), and EPSPs of variable amplitudes (green toorange). Fields that elicit a response with a delay of <8 msec caused by direct dendritic activation are marked ingray even when EPSPs were additionally elicited. This separation was obtained by an analysis of the delay-to-onset times as shown in C. Stimulation of distal fields in layer IV elicited APs only at the depolarized holding potential of −60 mV, but not at the resting membrane potential of the cell of −69 mV.C, Delay-to-onset times calculated from responses obtained from two IB and two RS cells recorded in low Ca2+/high Mg2+-ACSF as well as in normal ACSF. In low Ca2+/high Mg2+-ACSF all responses were recorded within the first 8 msec. In normal ACSF the delay-to-onset times of the first response are given. Note that the responses with a delay-to-onset <8 msec are comparable to the responses recorded in low Ca2+/high Mg2+-ACSF. The remaining responses had delay-to-onset times >10 msec.D, Representative responses recorded in low Ca2+/high Mg2+-ACSF (red) and normal ACSF (black) to activation of fields as shown in A and B. Suprathreshold depolarization was caused by direct perisomatic activation (trace 1). Direct dendritic activation causes a transient depolarization (trace 2). Activation of the same site in normal ACSF induces an excitatory input to the IB cell consisting of summed EPSPs (trace 3), in addition to the direct dendritically evoked depolarization. Synaptic excitatory and inhibitory inputs during stimulation of sites in ACSF are shown intraces 4 and 5. In these and the following maps, the borders of the barrels are outlined inblack.
Fig. 10.
Fig. 10.
Representative topographic maps of functional connectivity of an IB cell (A) and an RS cell (B) at Vhold = −60 mV. The maps illustrate the integrals of EPSPs recorded within 150 msec after stimulus, fields of origin for inhibitory inputs, and action potentials. Note that the IB cells as well as the RS cells receive excitatory inputs during stimulation of fields in layers II–VI. A photomicrograph indicating the enlarged cortical area within the slice (outlined in white) and the response of the cells to injection of depolarizing and hyperpolarizing current pulses in normal ACSF at Vrmp (IB cell: −70 mV; RS cell: −67 mV) are presented below the respective maps.
Fig. 11.
Fig. 11.
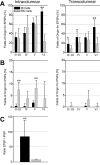
Percentages of presynaptic fields generating excitatory (A) and inhibitory (B) inputs onto layer V pyramidal cells in relationship to layer- and column-dependent location: IB cells (black columns; n = 7) and RS cells (gray columns; n = 8).C, Ratio of fields generating EPSPs to fields generating IPSPs in IB cells and RS cells. Data are mean ± SD.Asterisks indicate significant differences atp < 0.05 (*) and p < 0.01(**) levels.

Similar articles

Cited by

References

    1. Agmon A, Connors BW. Thalamocortical responses of mouse somatosensory (barrel) cortex in vitro. Neuroscience. 1991;41:365–379. - PubMed
    1. Ahissar E, Sosnik R, Haidarliu S. Transformation from temporal to rate coding in a somatosensory thalamocortical pathway. Nature. 2000;406:302–306. - PubMed
    1. Amitai Y. Membrane potential oscillations underlying firing patterns in neocortical neurons. Neuroscience. 1994;63:151–161. - PubMed
    1. Angulo MC, Staiger JF, Rossier J, Audinat E. Developmental synaptic changes increase the range of integrative capabilities of an identified excitatory neocortical connection. J Neurosci. 1999;19:1566–1576. - PMC - PubMed
    1. Armstrong-James M. The functional status and columnar organization of single cells responding to cutaneous stimulation in neonatal rat somatosensory cortex S1. J Physiol (Lond) 1975;246:501–538. - PMC - PubMed

Publication types

MeSH terms

LinkOut - more resources