

Coding specificity in cortical microcircuits: a multiple-electrode analysis of primate prefrontal cortex
- PMID: 11331394
- PMCID: PMC6762477
- DOI: 10.1523/JNEUROSCI.21-10-03646.2001
Coding specificity in cortical microcircuits: a multiple-electrode analysis of primate prefrontal cortex
Abstract
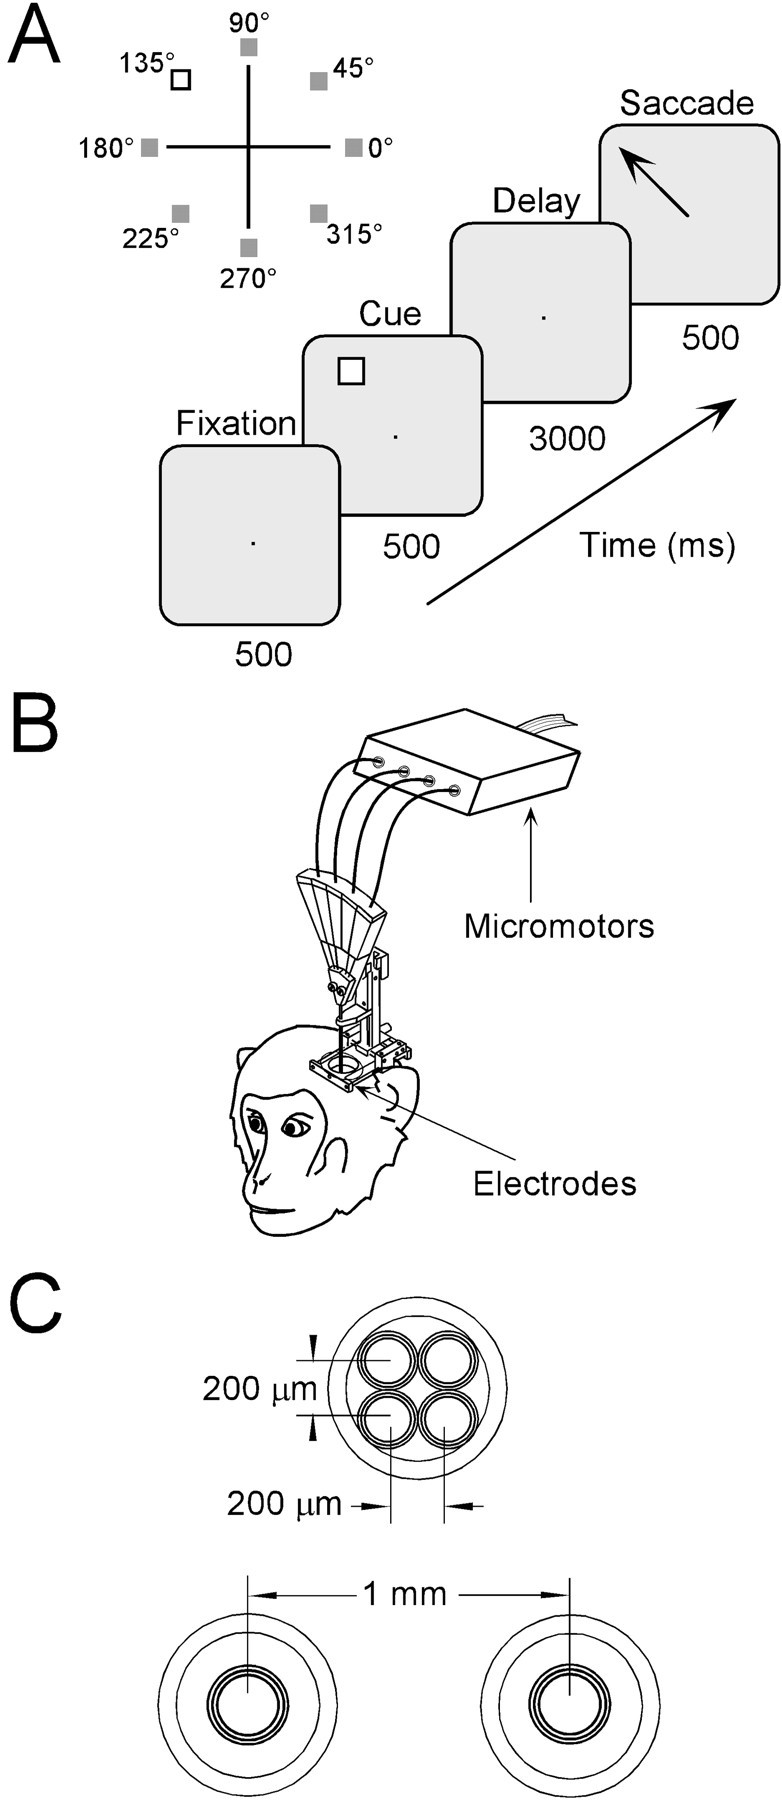
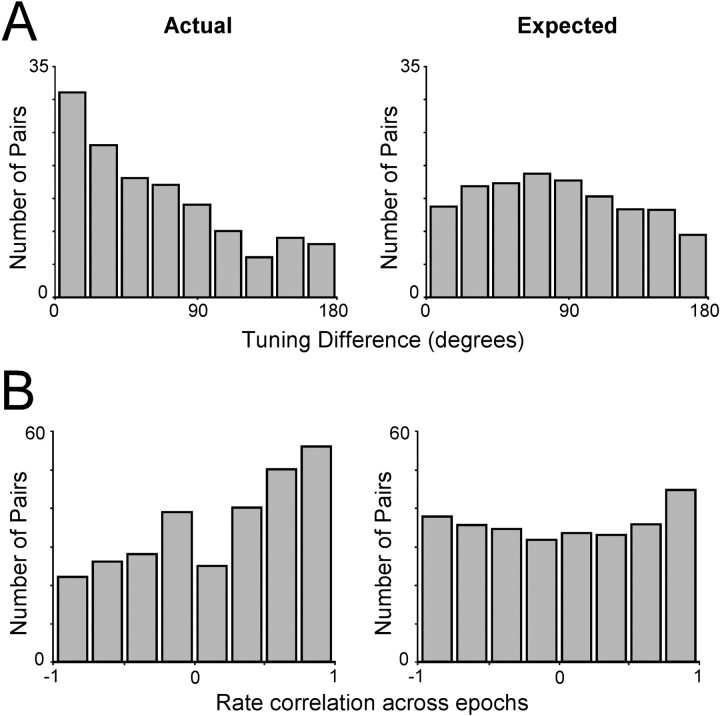
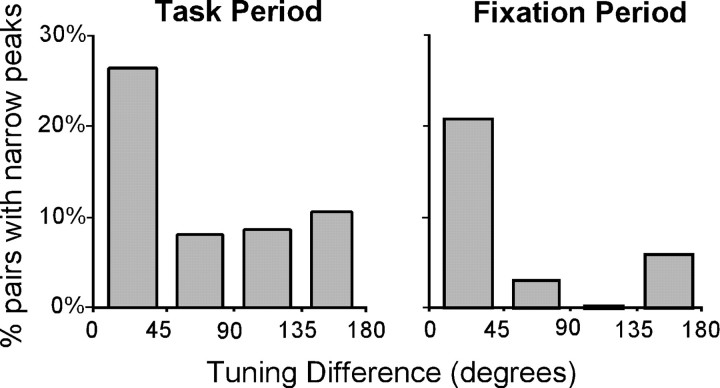
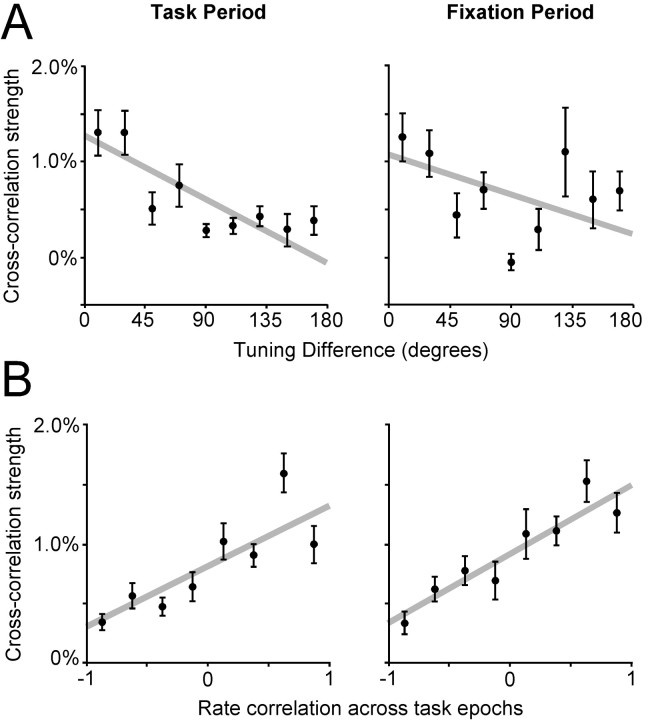
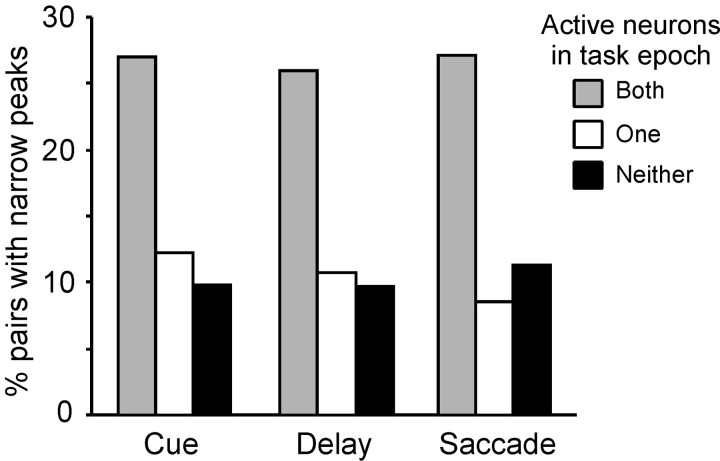
Neurons with directional specificities are active in the prefrontal cortex (PFC) during tasks that require spatial working memory. Although the coordination of neuronal activity in PFC is thought to be maintained by a network of recurrent connections, direct physiological evidence regarding such networks is sparse. To gain insight into the functional organization of the working memory system in vivo, we recorded simultaneously from multiple neurons spaced 0.2-1 mm apart in monkeys performing an oculomotor delayed response task. We used cross-correlation analysis and characterized the effective connectivity between neurons in relation to their spatial and temporal response properties. The majority of narrow (<5 msec) cross-correlation peaks indicated common input and were most often observed between pairs of neurons within 0.3 mm of each other. Neurons recorded at these distances represented the full range of spatial locations, suggesting that the entire visual hemifield is represented in modules of corresponding dimensions. Nearby neurons could be activated in any epoch of the behavioral task (stimulus presentation, delay, response). The incidence and strength of cross-correlation, however, was highest among cells sharing similar spatial tuning and similar temporal profiles of activation across task epochs. The dependence of correlated discharge on the functional properties of neurons was observed both when we analyzed firing from the task period as well as from baseline fixation. Our results suggest that the coding specificity of individual neurons extends to the local circuits of which they are part.
Figures


Similar articles
-
Prefrontal task-related activity representing visual cue location or saccade direction in spatial working memory tasks.J Neurophysiol. 2002 Jan;87(1):567-88. doi: 10.1152/jn.00249.2001. J Neurophysiol. 2002. PMID: 11784772
-
Matching patterns of activity in primate prefrontal area 8a and parietal area 7ip neurons during a spatial working memory task.J Neurophysiol. 1998 Jun;79(6):2919-40. doi: 10.1152/jn.1998.79.6.2919. J Neurophysiol. 1998. PMID: 9636098
-
Time course of functional connectivity in primate dorsolateral prefrontal and posterior parietal cortex during working memory.PLoS One. 2013 Nov 19;8(11):e81601. doi: 10.1371/journal.pone.0081601. eCollection 2013. PLoS One. 2013. PMID: 24260582 Free PMC article.
-
Prefrontal cortex and working memory processes.Neuroscience. 2006 Apr 28;139(1):251-61. doi: 10.1016/j.neuroscience.2005.07.003. Epub 2005 Dec 1. Neuroscience. 2006. PMID: 16325345 Review.
-
Information processes in the primate prefrontal cortex in relation to working memory processes.Rev Neurosci. 2002;13(4):313-45. doi: 10.1515/revneuro.2002.13.4.313. Rev Neurosci. 2002. PMID: 12542260 Review.
Cited by
-
Interplay between persistent activity and activity-silent dynamics in the prefrontal cortex underlies serial biases in working memory.Nat Neurosci. 2020 Aug;23(8):1016-1024. doi: 10.1038/s41593-020-0644-4. Epub 2020 Jun 22. Nat Neurosci. 2020. PMID: 32572236 Free PMC article.
-
From cognitive to neural models of working memory.Philos Trans R Soc Lond B Biol Sci. 2007 May 29;362(1481):761-72. doi: 10.1098/rstb.2007.2086. Philos Trans R Soc Lond B Biol Sci. 2007. PMID: 17400538 Free PMC article. Review.
-
γ And β Band Oscillation in Working Memory Given Sequential or Concurrent Multiple Items: A Spiking Network Model.eNeuro. 2023 Nov 7;10(11):ENEURO.0373-22.2023. doi: 10.1523/ENEURO.0373-22.2023. Print 2023 Nov. eNeuro. 2023. PMID: 37903618 Free PMC article.
-
The electrotonic structure of pyramidal neurons contributing to prefrontal cortical circuits in macaque monkeys is significantly altered in aging.Cereb Cortex. 2009 Oct;19(10):2248-68. doi: 10.1093/cercor/bhn242. Epub 2009 Jan 15. Cereb Cortex. 2009. PMID: 19150923 Free PMC article.
-
A computational model for the loss of neuronal organization in microcolumns.Biophys J. 2014 May 20;106(10):2233-42. doi: 10.1016/j.bpj.2014.04.012. Biophys J. 2014. PMID: 24853752 Free PMC article.
References
-
- Abeles M, Bergman H, Margalit E, Vaadia E. Spatiotemporal firing patterns in the frontal cortex of behaving monkeys. J Neurophysiol. 1993;70:1629–1638. - PubMed
-
- Aertsen AM, Gerstein GL, Habib MK, Palm G. Dynamics of neuronal firing correlation: modulation of “effective connectivity.”. J Neurophysiol. 1989;61:900–917. - PubMed
-
- Alonso JM, Martinez LM. Functional connectivity between simple cells and complex cells in cat striate cortex. Nat Neurosci. 1998;1:395–403. - PubMed
-
- Amit DJ, Brunel N. Model of global spontaneous activity and local structured activity during delay periods in the cerebral cortex. Cereb Cortex. 1997;7:237–252. - PubMed
Publication types
MeSH terms
Grants and funding
LinkOut - more resources
Full Text Sources
Miscellaneous