. 2001 May 1;20(9):2202-13.
doi: 10.1093/emboj/20.9.2202.

SNAREs are concentrated in cholesterol-dependent clusters that define docking and fusion sites for exocytosis

Affiliations

SNAREs are concentrated in cholesterol-dependent clusters that define docking and fusion sites for exocytosis

T Lang et al. EMBO J. .

Abstract

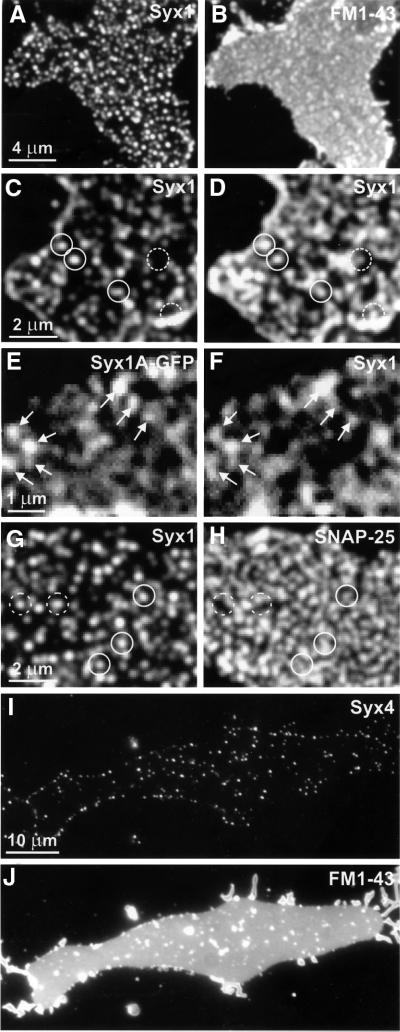
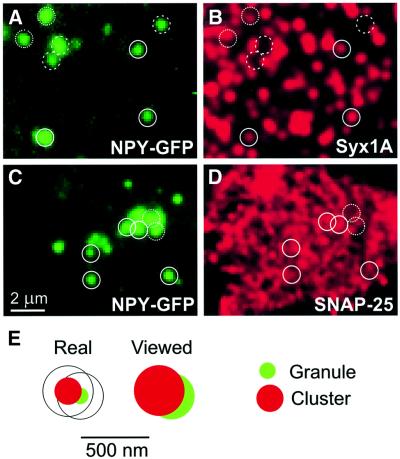
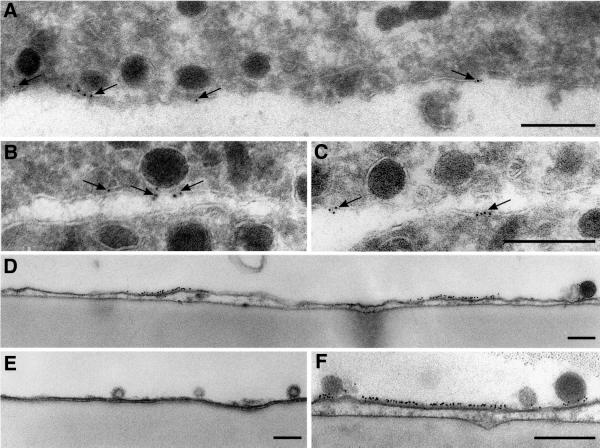
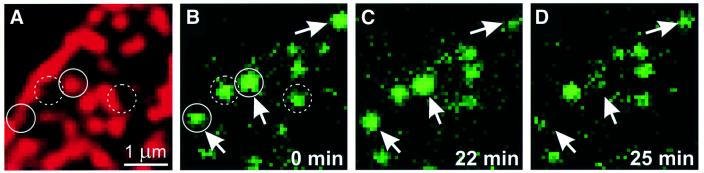
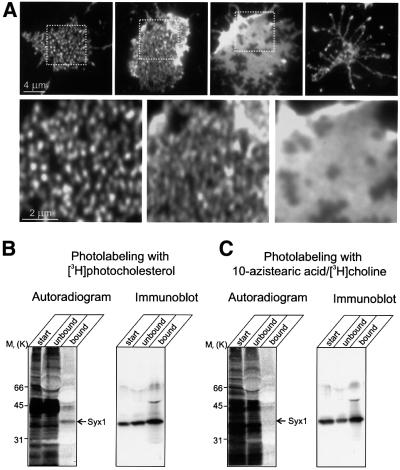
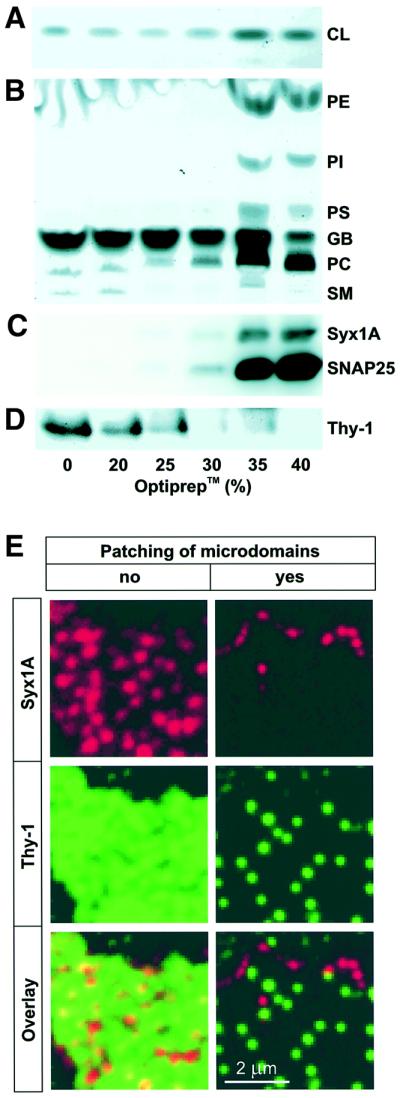
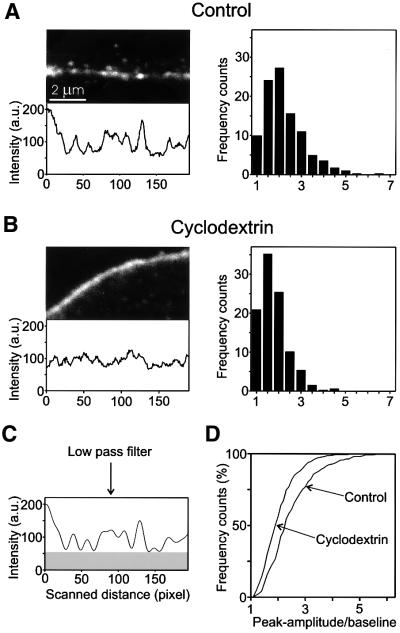
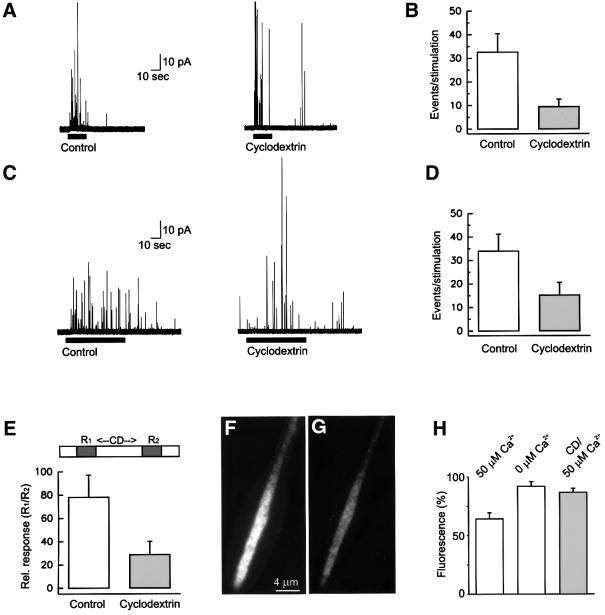
During exocytosis, SNARE proteins of secretory vesicles interact with the corresponding SNARE proteins in the plasmalemma to initiate the fusion reaction. However, it is unknown whether SNAREs are uniformly distributed in the membrane or whether specialized fusion sites exist. Here we report that in the plasmalemma, syntaxins are concentrated in 200 nm large, cholesterol-dependent clusters at which secretory vesicles preferentially dock and fuse. The syntaxin clusters are distinct from cholesterol-dependent membrane rafts since they are Triton X-100-soluble and do not co-patch with raft markers. Synaptosomal-associated protein (SNAP)-25 is also clustered in spots, which partially overlap with syntaxin. Cholesterol depletion causes dispersion of these clusters, which is associated with a strong reduction in the rate of secretion, whereas the characteristics of individual exocytic events are unchanged. This suggests that high local concentrations of SNAREs are required for efficient fusion.


Figures

None
Fig. 1. SNAREs are clustered in plasma membrane sheets derived from PC12 (A–H) or BHK cells (I and J). (A and B) Fixed sheets were immunostained for syntaxin 1 (A) followed by staining with FM1-43 (B) to visualize phospholipid membranes. Syntaxin is distributed in numerous brightly fluorescent dots (A). Fluorescence arising from stained syntaxin can not be seen through the brighter FM1-43 fluorescence (B). (C and D) Unfixed membrane sheets were stained for syntaxin 1 and imaged (C). They were then fixed and re-stained (D). Closed circles indicate syntaxin clusters on fixed membrane sheets that were already positive on the unfixed membrane sheet; dashed circles indicate syntaxin clusters that were visible only after fixation. Note that often a higher concentration of dots was observed at the rim of the membrane sheets (C and D), which is probably due to some membrane curling at the edges. (E and F) Imaging of an unfixed membrane sheet derived from a PC12 cell expressing syntaxin 1A–GFP (E), followed by immunostaining for syntaxin 1 (F). Arrows highlight spots that remained unchanged after antibody labeling. (G and H) Fixed membrane sheets double-stained for syntaxin 1 (G) and SNAP-25 (H). Spots positive for syntaxin 1 are positive (closed circles) or negative (dashed circles) for SNAP-25. (I and J) Unfixed membrane sheets immunostained for syntaxin 4 (I) followed by FM1-43 staining (J). Fluorescent spots on membranes derived from BHK cells were less numerous than syntaxin 1-positive spots on PC12-cell membranes.
None
Fig. 2. Secretory vesicles are preferentially docked to sites on membrane sheets that contain clusters of syntaxin 1 and SNAP-25. (AD) Secretory vesicles colocalize with syntaxin 1 or SNAP-25. Membrane sheets were generated from cells expressing the secretory granule marker NPY–GFP, fixed and immunostained for either syntaxin 1 (A and B) or SNAP-25 (C and D). Circles were super imposed on spots of GFP fluorescence (A and C) and transferred to identical pixel locations of the corresponding immunofluorescence picture (B and D). Closed circles, vesicles with a corresponding signal; dotted circles, vesicles with an only partially corresponding overlap; dashed circles, vesicles with no detectable corresponding immuno reactivity. (E) Criteria for rating the association of granules with clusters. Left, cartoon of a granule (green, 120 nm-diameter) touching with its tip the edge of a cluster (red, 200 nm-diameter). Right, as above but after considering the diffraction-induced spreading of the signal by the objective lens (granule 340 nm, cluster 370 nm). Granules were rated to be associated with a cluster (positive) when their signals were at least overlapped to the degree shown; less-overlapping granules were rated as negative; in some cases, a clear assessment was not possible (rated as neutral).
None
Fig. 3. Syntaxin clusters are visible after immuno-gold electron microscopy of PC12 cells (A–C) or of membrane sheets (D–F). (AC) Ultrathin frozen sections were immuno-gold labeled for syntaxin 1 and viewed by electron microscopy. Gold grains (arrows) are frequently clustered and label specifically the plasma membrane. Gold clusters are found at contact sites between vesicles and the plasma membrane (A and B), but also at sites where apparently no granules reside (C). Membrane sheets were immuno-gold labeled for syntaxin 1, fixed and embedded for electron microscopy. (DF) Gold grains form 100–200 nm-large carpets that are associated with secretory vesicles. (E) Control, where the primary antibody has been omitted. Scale bars, 250 nm.
None
Fig. 4. Secretory granules undergo exocytosis at syntaxin clusters. Unfixed, syntaxin-stained (red) membrane sheet produced from a cell expressing the secretory granule marker NPY–GFP (green). Syntaxin 1 (A) and NPY–GFP (BD), imaged at various times after stimulation of exocytosis with elevated concentrations of free calcium in the presence of Mg-ATP and rat brain cytosol (times are indicated). Arrows indicate granules that display exocytic activity during the stimulation period, resulting in their disappearance or dimming. Circles mark identical regions in (A) and (B). Continuous circles, granules that are associated with a cluster; dashed circles, granules that lack a corresponding signal. Note that the pattern of syntaxin clusters did not change during the experiment.
None
Fig. 5. The integrity of syntaxin clusters depends on cholesterol. (A) Clusters disintegate upon cholesterol depletion.Unfixed membrane sheets were treated for 30 min at 37°C with 15 mM methyl-β-cyclodextrin and then immunostained for syntaxin 1. Upper row, membranes displaying increasing degrees of cyclodextrin-induced changes. Spots become less separated until a uniform distribution of the label is observed. Finally, membranes disintegrate. Boxes in the images indicate regions that are magnified below. (B and CIn vivo labeling of syntaxin 1 with photocholesterol. PC12 cells were photoaffinity labeled with either [3H]photocholesterol (B) or 10-azistearic acid/[3H]choline (C). Syntaxin was immunoprecipitated from detergent-extracted cell lysates using a monoclonal antibody against syntaxin 1. Aliquots of starting extracts (start), the supernatants after immunoprecipitation (unbound) and the immunoprecipitates (bound) were subjected to SDS–PAGE followed by blotting on nitrocellulose membrane. Left, autoradiographs (detected by phosphoimaging); right, immunoblots for syntaxin 1(using a polyclonal antibody) of the same membranes. For comparison, the starting material was adjusted to approximately equal amounts of radioactivity.
None
Fig. 6. Syntaxin clusters are distinct from DRMs. (AD) Syntaxin clusters do not float on a density gradient after extraction with Triton X-100. Fractions of an OptiprepTM-sucrose flotation step gradient from cells extracted with 1% Triton X-100 were analyzed by HP-TLC (A and B) and immunoblotting using monoclonal antibodies against syntaxin 1 and SNAP-25 (C) or Thy-1 (D). (A) CL, cholesterol. (B) PE, phosphatidylethanolamine; PI, phosphatidylinositol; PS, phosphatidylserine; GB, gradient buffer; PC, phosphatidylcholine; SM, sphingomyelin, all as judged by comparison with standard markers or gradient buffer. (E) Syntaxin- and Thy-1-microdomains do not co-patch upon antibody-induced cross-linking. Left, numerous spots of syntaxin 1 (red) and Thy-1 (green) are visualized by indirect immunofluorescence on unfixed membrane sheets when excess amounts of primary and secondary antibodies were used. Right, same protocol, but primary and secondary antibodies were diluted to maximize cross-linking of microdomains, resulting in clear segregation of the Thy-1 and syntaxin 1 signal to different patches.
None
Fig. 7. Disintegration of syntaxin clusters upon cholesterol depletion of intact PC12 cells. Confocal micrographs taken from the periphery of aldehyde-fixed PC12 cells stained for syntaxin 1. Prior to immuno staining, cells were either treated for 60 min with Ringer solution (A), or for 30 min with Ringer solution followed by 30 min 15 mM methyl-β-cyclodextrin in Ringer solution (B). For quantitative analysis of the differences between control and cyclodextrin-treated cells, a 600-nm-wide line scan (not shown for clarity) was put through the center of the peripheral fluorescence, and the fluorescence intensity was recorded (lower panels). Intensity traces were low-pass filtered to remove noise [(C), compare traces shown in (C) and (A)]. For each condition, the ratios of individual peak amplitudes to the basal fluorescence signal [see gray box in (C)] was determined from filtered traces and plotted as histograms [right panels in (A) and (B)]. (D) Histograms shown in (A) and (B) presented as cumulative plots.
None
Fig. 8. Cholesterol depletion inhibits exocytosis. (A) Superfusion of cells with a depolarizing solution (containing 80 mM KCl; bar) triggers an increase in the frequency of amperometric spikes (left trace) that is substantially reduced in methyl-β-cyclodextrin-treated cells (right trace). (B) Analysis of traces as exemplified in (A). In control cells, 32.6 ± 7.8 events (n = 9 cells) were detected in a stimulation period of 20 s versus 9.46 ± 3.1 events (n = 13 cells) in cyclodextrin-treated cells. (C) Superfusion of cells with ionomycin (2.5 µM; bar) triggers an increase in the frequency of amperometric spikes (left trace) that is substantially reduced in methyl-β-cyclodextrin-treated cells (right trace). (D) Quantitative analysis of traces as exemplified in (C). In control cells, 34 ± 7.2 events (n = 12 cells) were detected in a stimulation period of 60 s versus 15.2 ± 5.4 events (n = 11 cells) in cyclodextrin-treated cells. (E) Inhibition of exocytosis after a short time application of methyl-β-cyclodextrin. Cells were stimulated for 20 s with a depolarizing solution [as in (A)], superfused for 2 min with Ringer solution (control) or Ringer solution containing 15 mM methyl-β-cyclodextrin, and then superfused again for 20 s with a depolarizing solution for a second stimulation. The number of events of the first response (R1) was normalized to 100%. The following values were obtained for the second stimulation (R2): control cells, 78.1 ± 19% (n = 9 cells); cyclodextrin-treated cells, 28.7 ± 11% (n = 13). (F and G) Neurite from a NGF-differentiated PC12 cell expressing the secretory granule marker NPY–GFP before (F) and after (G) stimulation. The neurite was stimulated to secrete NPY–GFP into the buffer by permeabilization of the plasma membrane with digitonin in the presence of 50 µM free calcium, Mg-ATP and rat brain cytosol. Exocytosis is measured by the loss of GFP fluorescence from the neurite. (H) Quantitative determination (by video microscopy) of neurite fluorescence. In the presence of calcium, neurites lost 35.7 ± 5% (n = 18) of their GFP fluorescence; when calcium was omitted, a decrease of 8.2 ± 4% (n = 11) was observed. Pretreatment of neurites with 15 mM methyl-β-cyclodextrin for 30 min led to a decrease of only 13.3 ± 3.4% (n = 19), although calcium was present. Values are given as mean ± SEM.

Similar articles

Cited by

References

    1. Aguado F., Majo,G., Ruiz-Montasell,B., Canals,J.M., Casanova,A., Marsal,J. and Blasi,J. (1996) Expression of synaptosomal-associated protein SNAP-25 in endocrine anterior pituitary cells. Eur. J. Cell Biol., 69, 351–359. - PubMed
    1. Angleson J.K., Cochilla,A.J., Kilic,G., Nussinovitch,I. and Betz,W.J. (1999) Regulation of dense core release from neuroendocrine cells revealed by imaging single exocytic events. Nature Neurosci., 2, 440–446. - PubMed
    1. Avery J., Ellis,D.J., Lang,T., Holroyd,P., Riedel,D., Henderson,R.M., Edwardson,J.M. and Jahn,R. (2000) A cell-free system for regulated exocytosis in PC12 cells. J. Cell Biol., 148, 317–324. - PMC - PubMed
    1. Barnstable C.J., Hofstein,R. and Akagawa,K. (1985) A marker of early amacrine cell development in rat retina. Brain Res., 352, 286–290. - PubMed
    1. Bennett M.K. and Scheller,R.H. (1993) The molecular machinery for secretion is conserved from yeast to neurons. Proc. Natl Acad. Sci. USA, 90, 2559–2563. - PMC - PubMed

MeSH terms