

Transitions in histone acetylation reveal boundaries of three separately regulated neighboring loci
- PMID: 11331588
- PMCID: PMC125441
- DOI: 10.1093/emboj/20.9.2224
Transitions in histone acetylation reveal boundaries of three separately regulated neighboring loci
Abstract
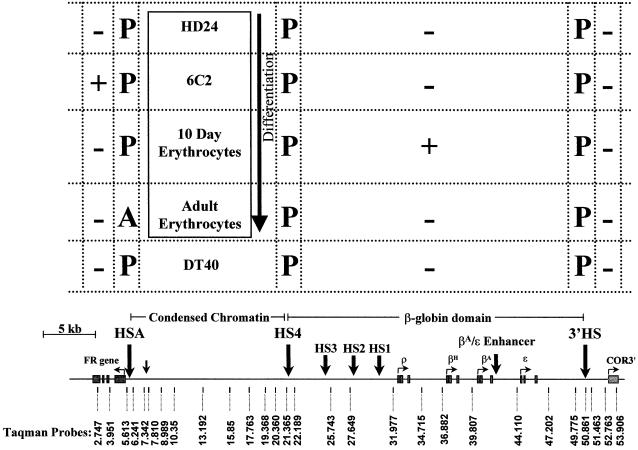
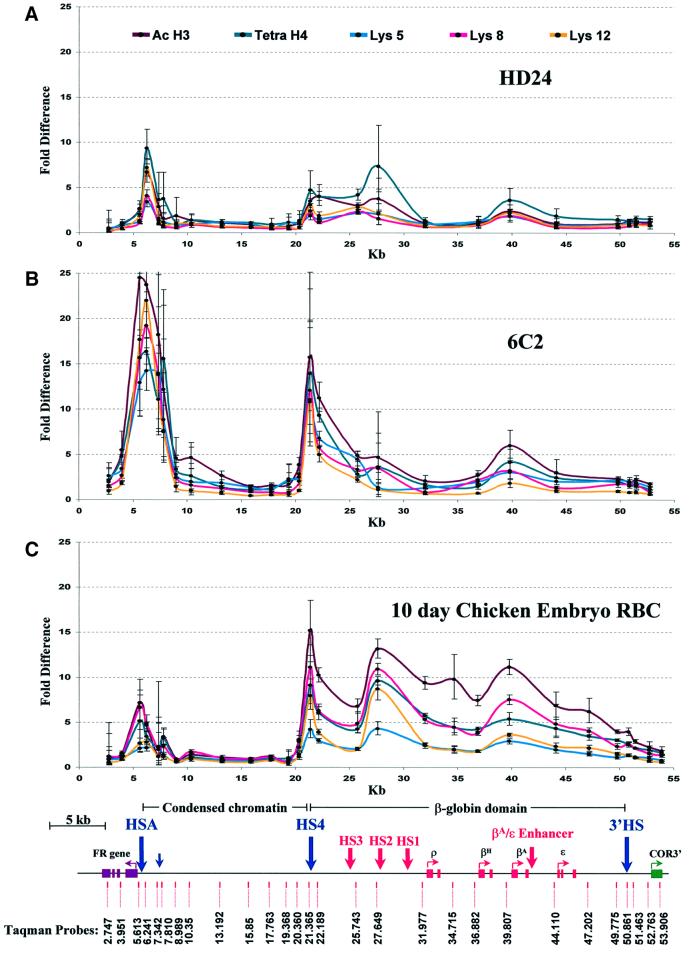
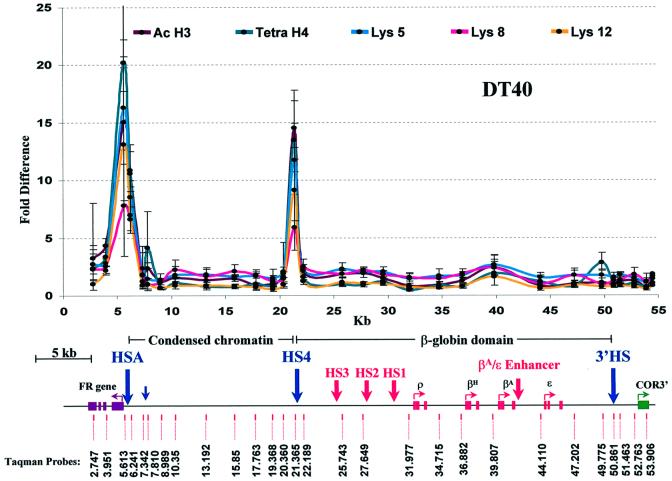
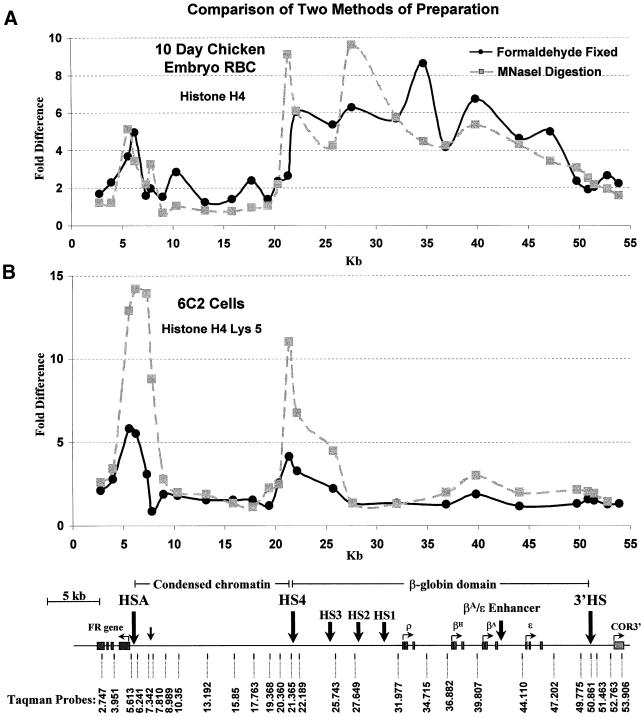
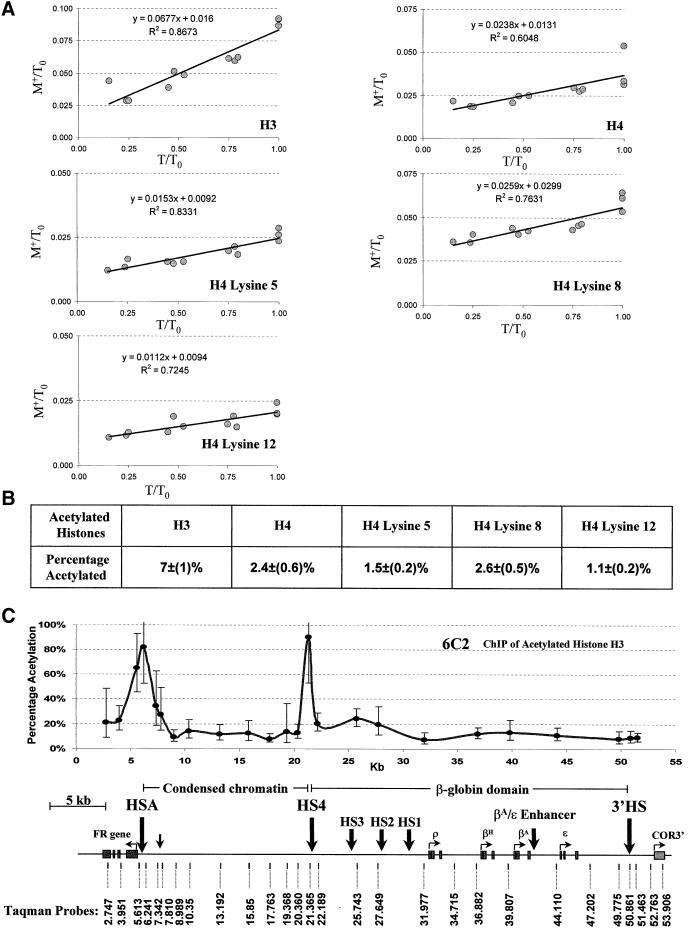
We have studied developmentally regulated patterns of histone acetylation at high resolution across approximately 54 kb of DNA containing three independently regulated but neighboring genetic loci. These include a folate receptor gene, a 16 kb condensed chromatin region, the chicken beta-globin domain and an adjacent olfactory receptor gene. Within these regions the relative levels of acetylation appear to fall into three classes. The condensed chromatin region maintains the lowest acetylation at every developmental stage. Genes that are inactive show similarly low levels, but activation results in a dramatic increase in acetylation. The highest levels of acetylation are seen at regulatory sites upstream of the genes. These patterns imply the action of more than one class of acetylation. Notably, there is a very strong constitutive focus of hyperacetylation at the 5' insulator element separating the globin locus from the folate receptor region, which suggests that this insulator element may harbor a high concentration of histone acetylases.
Figures
Similar articles
-
Correlation between histone lysine methylation and developmental changes at the chicken beta-globin locus.Science. 2001 Sep 28;293(5539):2453-5. doi: 10.1126/science.1064413. Epub 2001 Aug 9. Science. 2001. PMID: 11498546
-
An insulator element and condensed chromatin region separate the chicken beta-globin locus from an independently regulated erythroid-specific folate receptor gene.EMBO J. 1999 Jul 15;18(14):4035-48. doi: 10.1093/emboj/18.14.4035. EMBO J. 1999. PMID: 10406808 Free PMC article.
-
Developmental stage differences in chromatin subdomains of the beta-globin locus.Proc Natl Acad Sci U S A. 2004 May 4;101(18):7028-33. doi: 10.1073/pnas.0307985101. Epub 2004 Apr 22. Proc Natl Acad Sci U S A. 2004. PMID: 15105444 Free PMC article.
-
Site-specific analysis of histone methylation and acetylation.Methods Mol Biol. 2004;287:99-120. doi: 10.1385/1-59259-828-5:099. Methods Mol Biol. 2004. PMID: 15273407 Review.
-
Chromatin domains and regulation of gene expression: familiar and enigmatic clusters of chicken globin genes.Crit Rev Eukaryot Gene Expr. 2001;11(1-3):227-42. Crit Rev Eukaryot Gene Expr. 2001. PMID: 11693962 Review.
Cited by
-
A key role for Chd1 in histone H3 dynamics at the 3' ends of long genes in yeast.PLoS Genet. 2012;8(7):e1002811. doi: 10.1371/journal.pgen.1002811. Epub 2012 Jul 12. PLoS Genet. 2012. PMID: 22807688 Free PMC article.
-
Histone acetylation at the human beta-globin locus changes with developmental age.Blood. 2007 Dec 1;110(12):4101-7. doi: 10.1182/blood-2007-05-091256. Epub 2007 Sep 19. Blood. 2007. PMID: 17881636 Free PMC article.
-
Broadening of DNA replication origin usage during metazoan cell differentiation.EMBO Rep. 2006 Aug;7(8):806-11. doi: 10.1038/sj.embor.7400736. Epub 2006 Jun 16. EMBO Rep. 2006. PMID: 16799461 Free PMC article.
-
Replication of the chicken beta-globin locus: early-firing origins at the 5' HS4 insulator and the rho- and betaA-globin genes show opposite epigenetic modifications.Mol Cell Biol. 2003 May;23(10):3536-49. doi: 10.1128/MCB.23.10.3536-3549.2003. Mol Cell Biol. 2003. PMID: 12724412 Free PMC article.
-
Global chromatin structure of 45,000 base pairs of chromosome III in a- and alpha-cell yeast and during mating-type switching.Mol Cell Biol. 2004 Nov;24(22):10026-35. doi: 10.1128/MCB.24.22.10026-10035.2004. Mol Cell Biol. 2004. PMID: 15509803 Free PMC article.
References
-
- Baba T.W., Giroir,B.P. and Humphries,E.H. (1985) Cell lines derived from avian lymphomas exhibit two distinct phenotypes. Virology, 144, 139–151. - PubMed
-
- Bannister A.J. and Kouzarides,T. (1996) The CBP co-activator is a histone acetyltransferase. Nature, 384, 641–643. - PubMed
-
- Bell A.C. and Felsenfeld,G. (1999) Stopped at the border: boundaries and insulators. Curr. Opin. Genet. Dev., 9, 191–198. - PubMed
-
- Bell A., Boyes,J., Chung,J., Pikaart,M., Prioleau,M.N., Recillas,F., Saitoh,N. and Felsenfeld,G. (1998) The establishment of active chromatin domains. Cold Spring Harb. Symp. Quant. Biol., 63, 509–514. - PubMed
-
- Bell A.C., West,A.G. and Felsenfeld,G. (1999) The protein CTCF is required for the enhancer blocking activity of vertebrate insulators. Cell, 98, 387–396. - PubMed
MeSH terms
Substances
LinkOut - more resources
Full Text Sources
Other Literature Sources
