. 2001 May 8;98(10):5649-54.
doi: 10.1073/pnas.091110798. Epub 2001 May 1.

Changes in global gene expression patterns during development and maturation of the rat kidney

Affiliations

Changes in global gene expression patterns during development and maturation of the rat kidney

R O Stuart et al. Proc Natl Acad Sci U S A. .

Abstract

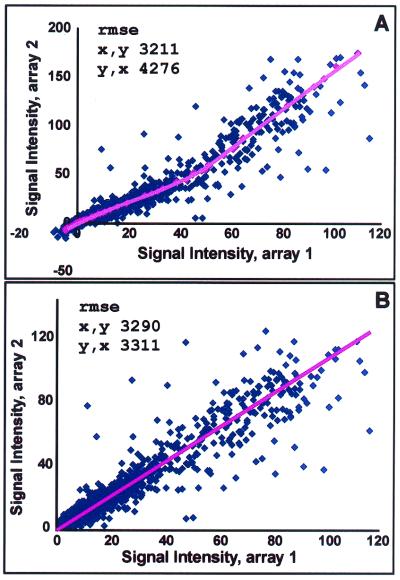
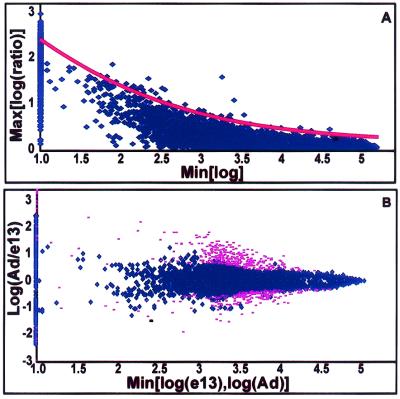
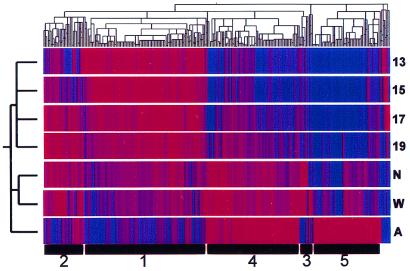
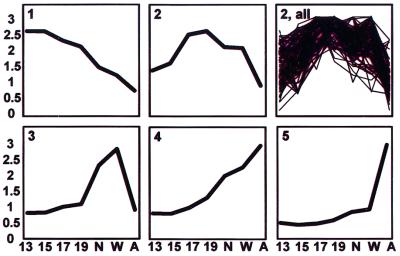
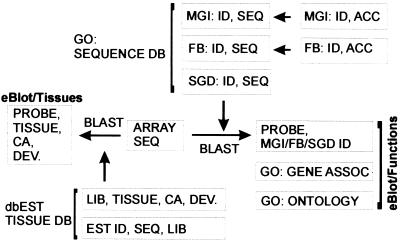
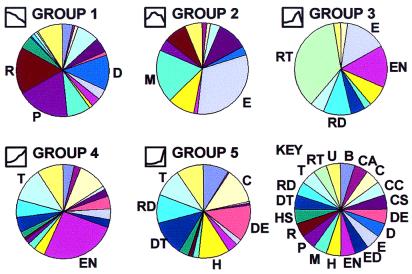
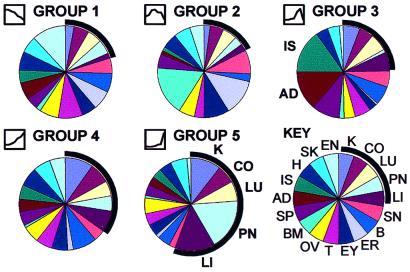
We set out to define patterns of gene expression during kidney organogenesis by using high-density DNA array technology. Expression analysis of 8,740 rat genes revealed five discrete patterns or groups of gene expression during nephrogenesis. Group 1 consisted of genes with very high expression in the early embryonic kidney, many with roles in protein translation and DNA replication. Group 2 consisted of genes that peaked in midembryogenesis and contained many transcripts specifying proteins of the extracellular matrix. Many additional transcripts allied with groups 1 and 2 had known or proposed roles in kidney development and included LIM1, POD1, GFRA1, WT1, BCL2, Homeobox protein A11, timeless, pleiotrophin, HGF, HNF3, BMP4, TGF-alpha, TGF-beta2, IGF-II, met, FGF7, BMP4, and ganglioside-GD3. Group 3 consisted of transcripts that peaked in the neonatal period and contained a number of retrotransposon RNAs. Group 4 contained genes that steadily increased in relative expression levels throughout development, including many genes involved in energy metabolism and transport. Group 5 consisted of genes with relatively low levels of expression throughout embryogenesis but with markedly higher levels in the adult kidney; this group included a heterogeneous mix of transporters, detoxification enzymes, and oxidative stress genes. The data suggest that the embryonic kidney is committed to cellular proliferation and morphogenesis early on, followed sequentially by extracellular matrix deposition and acquisition of markers of terminal differentiation. The neonatal burst of retrotransposon mRNA was unexpected and may play a role in a stress response associated with birth. Custom analytical tools were developed including "The Equalizer" and "eBlot," which contain improved methods for data normalization, significance testing, and data mining.


Figures

Figure 1
Figure 1
Data equalization. (A) Before being subjected to the normalization algorithm (here termed equalization), GeneChip expression data in many cases displayed systematic deviation from linearity in two-dimensional orthogonal projections of the original n-dimensional data matrix. Genes with expression values near the readily apparent central tendency are invariant in the two comparison conditions, but may display raw signals that deviate significantly. The datum in the upper right corner is representative of a large number of points that, in this example, display an ≈60% systematic shift toward higher value along the y axis as compared with the x axis condition, despite their clear association with the central trend of the data. In the example, The Equalizer has identified a group of points with identical rank order of signal intensity (window of ±5) in the two gene expression lists (red points) and applied a locally weighted nonlinear regression “smoother” to generate a best-fit description of the central trend of the data. (B) The best-fit line was then used as a normalization vector, which, when applied to the data matrix, resulted in linearized data with a slope very near to 1. Note that before equalization, a description of the data by linear regression techniques yielded different answers depending on which variable was considered dependent or independent [unequal root mean square error (rmse)]. The Equalizer also provides for shifting of the data to positive values to allow for subsequent log transformations. All gene intensities were then shifted to the positive by an amount corresponding to the 1.5th percentile (a user-defined value) gene intensity value. The ≈1.5% of genes with shifted values less than noise were then set to the noise value.
Figure 2
Figure 2
Scatter model. (A) The scatter in the data was expressed as a function of baseline expression in identical replicate samples. The scatter was described by the log ratio of two observations of the same gene, whereas baseline expression was described by the log of the minimum value observation. Scatter increased with decreasing levels of baseline expression and was easily modeled. More than 60,000 replicate measurements were distributed in the model and were bounded by an equation of the form Ae(Bx) + Cx + D, where A = 5, B = −0.65, C = 0.015, and D = 0. A score, termed Z, could then be calculated for each position in the error model. Z was normally distributed, and the P value associated with a given Z could be calculated as, formula image where erf is the error function, Zm = mean Z, Zs = standard deviation of Z from replicate observations. Each time point in kidney development was represented by two GeneChips, resulting in four possible pairwise comparisons. The multiple observations were combined into a summary P value by averaging signed Zs. A P value of 0.0025 corresponded to approximately the 1,000 most significantly changing genes (n = 980). The list was further reduced to 873 by excluding all genes labeled “absent” in all arrays, according to the Affymetrix algorithm. (B) Many genes were determined to be differentially expressed in a comparison of e13 with adult rat kidney RNA (red points). Several genes (outlying blue points) were not considered significant despite their apparent outlier status gained as a result of highly variable results for the given gene.
Figure 3
Figure 3
Hierarchical clustering. There were 873 genes identified as changing significantly at some point in kidney development. These 873 genes were clustered [by using the hierarchical clustering algorithm, genespring (Silicon Genetics)] in two dimensions according to their gene expression and experimental vectors in Euclidian space after compressing the equalized data to a target maximum value of 3. Numbers at the bottom indicate group numbers derived from k-means clustering. Group 1 genes are up-regulated (red) in the early embryonic period and decrease thereafter. Group 2 genes rise to a mid-late embryonic peak. Group 3 genes peak in the neonatal period. Group 4 genes rise somewhat linearly throughout development. Group 5 genes display a distinct peak in the adult vs. all earlier times. 13, 15, 17, 19, embryonic days; N, newborn; W, 1 week old; A, adult.
Figure 4
Figure 4
Temporal gene expression profiles during kidney development. Data are expressed as the mean at each time for clusters of genes as defined by k-means clustering (–5). The distribution of individual profiles is also shown for the most heterogeneous group (2, all). Identities of representative genes are shown in Table 1. 13, 15, 17, 19, embryonic days; N, newborn; W, 1 week old; A, adult.
Figure 5
Figure 5
eBlot database schema. The Affymetrix target sequences were updated by comparison to Unigene sequences and associated by sequence similarity with entries in publicly available databases. Individually curated gene function information was derived for genes without high scoring matches in Gene Ontology Consortium-linked databases. SGD, Saccharomyces Genome Database; FB, Flybase; MGI, Mouse Genome Informatics; dbEST, EST database (National Center for Biotechnology Information); GO, Gene Ontology Consortium, DEV, developmental stage; ID, identifier; SEQ, sequence; LIB, library; CA, cancer.
Figure 6
Figure 6
Functional associations of gene clusters. Gene clusters varied remarkably in terms of major functional classifications of component genes. Key (Lower right) indicates major gene functional classifications: B, biosynthetic; CA, cell adhesion; C, catabolism-small molecules; CC, cell cycle; CS, cytoskeletal; DE, defense; D, DNA structure or replication; E, extracellular matrix; ED, endocytosis; EN, energy metabolism; H, homeostasis of the organism; M, morphogenetic; P, protein synthesis or processing; R, RNA synthesis or processing; HS, heat-shock proteins; DT, detoxification of exogenous substances; RD, protection against oxidative stress; T, transport; RT, retrotransposon; U, unknown function. The icons preceding the group names were derived from Fig. 4 and display the associated temporal expression profile. Group 1 expressed earlier in nephrogenesis was most notable for genes involved in DNA replication (D), RNA production (R), protein synthesis (P), and morphogenesis (M), consistent with an actively proliferating tissue. Group 2 (which peaked in midnephrogenesis) was most notable for genes of the extracellular matrix (E) as well as morphogenetic genes (M). Group 3 (with a peak in neonatal life) was dominated by retrotransposon transcripts (RT). Group 4 was most notable for transport (T) and energy metabolism (EN) related genes. Group 5 genes (significantly up-regulated in the adult vs. all previous times) was more heterogeneous and included genes specifying catabolic enzymes (C), defense and immune recognition (DE), homeostasis of the organism as a whole (H), detoxification (DT), oxidative stress (RD), and transport (T).
Figure 7
Figure 7
Tissue distribution/association of cluster member genes in the EST database. Group member genes were associated with EST database entries by sequence similarity and the tissue associations were summarized as in Fig. 6. When kidney-, colon-, lung-, pancreas-, and liver-derived genes were found homologous (blast bit score ≥100) to any of the 873 significantly changed genes, they tended to come from group 4 and, particularly, group 5. The results provide independent evidence for the validity of the canonical clusters; genes that appeared late in kidney development (groups 4 and 5) were associated with EST source libraries consisting of branching ductal epithelial tissue. Interestingly, group 3 (dominated by retrotransposon RNA species) was more frequently associated with adrenal and islet tissues. Abbreviations: K, kidney; CO, colon; LU, lung; PN, pancreas; LI, liver; SN, skin; B, brain, ER, ear; EY, eye; T, testis; OV, ovary; BM, bone marrow; SP, spleen; AD, adrenal; IS, islets; H, heart; SK, skeletal muscle; EN, endothelium.

Similar articles

Cited by

References

    1. Saxen L. Organogenesis of the Kidney. Cambridge, U.K.: Cambridge Univ. Press; 1987.
    1. Pohl M, Stuart R O, Sakurai H, Nigam S K. Annu Rev Physiol. 2000;62:595–620. - PubMed
    1. Altschul S F, Madden T L, Schaffer A A, Zhang J, Zhang Z, Miller W, Lipman D J. Nucleic Acids Res. 1997;25:3389–3402. - PMC - PubMed
    1. Pavlova A, Stuart R O, Pohl M, Nigam S K. Am J Physiol. 1999;277:F650–F663. - PubMed
    1. Roberts C J, Nelson B, Marton M J, Stoughton R, Meyer M R, Bennett H A, He Y D, Dai H, Walker W L, Hughes T R, et al. Science. 2000;287:873–880. - PubMed

Publication types