. 2001 May;3(2):74-84.
doi: 10.1016/S1525-1578(10)60655-1.

Electronic detection of nucleic acids: a versatile platform for molecular diagnostics

Affiliations

Electronic detection of nucleic acids: a versatile platform for molecular diagnostics

R M Umek et al. J Mol Diagn. 2001 May.

Abstract

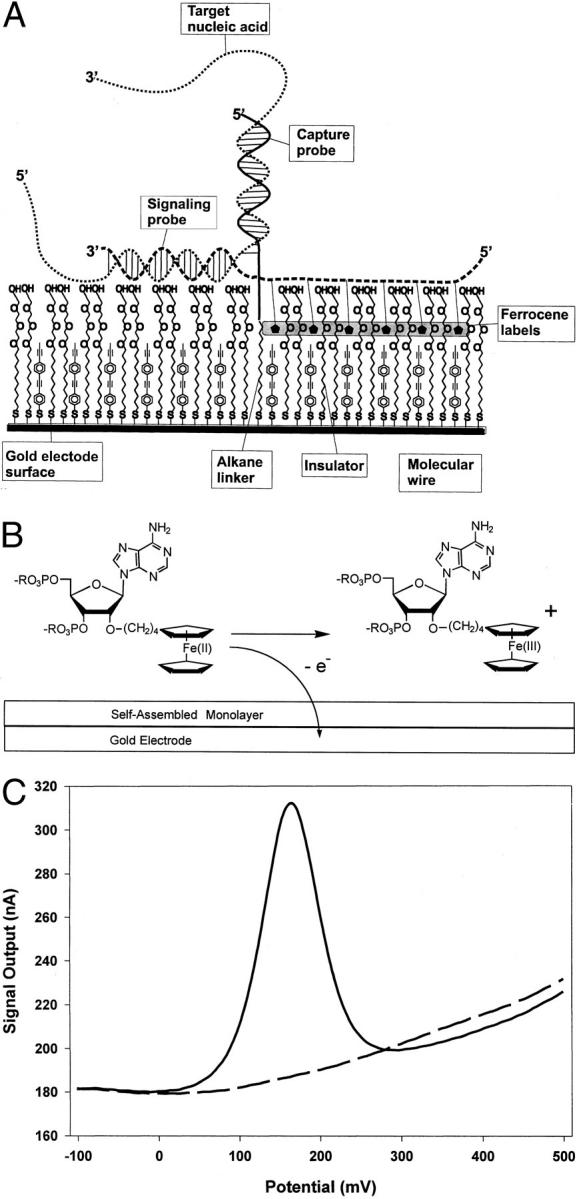
A novel platform for the electronic detection of nucleic acids on microarrays is introduced and shown to perform well as a selective detection system for applications in molecular diagnostics. A gold electrode in a printed circuit board is coated with a self-assembled monolayer (SAM) containing DNA capture probes. Unlabeled nucleic acid targets are immobilized on the surface of the SAM through sequence-specific hybridization with the DNA capture probe. A separate signaling probe, containing ferrocene-modified nucleotides and complementary to the target in the region adjoining the capture probe binding site, is held in close proximity to the SAM in a sandwich complex. The SAM allows electron transfer between the immobilized ferrocenes and the gold, while insulating the electrode from soluble redox species, including unbound signaling probes. Here, we demonstrate sequence-specific detection of amplicons after simple dilution of the reaction product into hybridization buffer. In addition, single nucleotide polymorphism discrimination is shown. A genotyping chip for the C282Y single nucleotide polymorphism associated with hereditary hemochromatosis is used to confirm the genotype of six patients' DNA. In addition, a gene expression-monitoring chip is described that surveys five genes that are differentially regulated in the cellular apoptosis response. Finally, custom modification of individual electrodes through sequence-specific hybridization demonstrates the potential of this system for infectious disease diagnostics. The versatility of the electronic detection platform makes it suitable for multiple applications in diagnostics and pharmacogenetics.


Figures

Figure 2.
Figure 2.
Electronic detection of PCR products. A: Line diagrams showing the sequence relationships among angiotensin-converting enzyme (ACE) alleles D and I as well as the D allele oligonucleotide target mimic, the signaling probe (SP), and the capture probes (CPs). The nucleotide coordinates are from GenBank (accession no. AF118569). The target mimic is 74 nucleotides and co-linear with the D allele. The SP is co-linear with both alleles. Two CPs were synthesized, one co-linear with the D allele through the sequence interrupted by the Alu insertion, the other co-linear with the sequence of the junction in the I allele. B: Fifty nanograms of genomic DNA (gDNA) were used to amplify a 192-bp amplicon from the ACE gene (allele D) which was heat denatured in the presence of a ferrocene-labeled signaling probe and applied as a 125 nmol/L solution of amplicon to an electrode array containing the D allele capture probe. For comparison, a 50 nmol/L solution of a 74-mer double-stranded target mimic and a 50 nmol/L solution of the single-stranded target mimic were used to challenge separate ACE chips. The products of a PCR that did not contain gDNA was similarly analyzed for comparison (neg). Hybridization proceeded for two hours before AC voltammetry was performed on individual electrodes of each chip. The mean and SD are reported from 7 electrodes/array and 2 arrays/target. No faradaic signal was detected on electrodes in the array that are modified with capture probes non-complementary to the ACE amplicon (not shown). C: A-PCR was performed and the reaction products were hybridized in the electrode array chambers for 20 minutes before analysis, as in B. The mean and SD of peak current are reported for two chips (1 and 2) from electrodes modified with the ACE D allele- or ACE I allele-specific capture probes.
Figure 3.
Figure 3.
Single-base mismatch discrimination on the bioelectronic sensor. A: Electrode arrays were prepared with capture probes complementary to a region of the HIV genome and a region of the HCV genome. The arrays were challenged with a 76-mer oligonucleotide containing a region of perfect complementarity to the HIV capture probe (designated wild-type) or a second 76-mer oligonucleotide containing a single base substitution (designated mutant), centered in the region complementary to the capture probe. Five hundred nmol/L of the target oligonucleotides and 2.5 μmol/L of a corresponding signaling probe were hybridized for 20 minutes at 25°C (two arrays were studied for each target) and the electrodes were interrogated by AC voltammetry (ACV). The mean of the peak current detected from 4 electrodes at 25°C was defined as 100% for each array. Subsequently, the temperature of the hybridization solution was elevated in 5°C increments. At each elevated temperature, the solution was held for 1 minute before interrogation of the electrodes by ACV. The mean of the peak faradaic current detected on four electrodes at each temperature is reported for each of the four arrays studied. Electrodes containing capture probes complementary to HCV gave no detectable faradaic current at any temperature (not shown). Note that the same electrodes are being scanned repeatedly at the various temperatures. B: Electrode arrays were prepared containing capture probes that are perfectly complementary to the wild-type or mutant HIV targets. The arrays also contained capture probes complementary to a portion of the HCV genome. Three separate arrays were challenged with a 500 nmol/L solution of the wild-type HIV target mimic (WT Target), the mutant target mimic (mut Target), or an equimolar mixture of the two oligonucleotides (Mix). After 20 minutes at 25°C, the electrodes were interrogated and the resulting peak current measured (not shown). Subsequently, the temperature of the solutions was elevated to 52°C. The reaction volume was held at the elevated temperature for 1 minute before ACV interrogation of the electrodes. The mean and SD of the peak current detected from 4 electrodes of each type, wild-type or mutant, are reported for the three arrays. Above the signal outputs recorded at 52°C, the ratio of the means is reported as wild-type/mutant. No signal was detected at any temperature from the electrodes containing capture probes complementary to HCV (not shown). On the left-hand side, the results are reported after normalizing the signal output for each electrode type to 100% at 25°C. Above the normalized signal outputs at 52°C, the ratio of the normalized means is reported as wild-type/mutant. The targets are given the suffix n in the normalized data. C: Line diagrams showing the position of the C282Y SNP (a G-to-A substitution at nucleotide position 845) in the Hfe gene and the relationships among the amplicon (top line), the target mimics, the CPs, and the SP. The target mimics contain a G (wild-type) or an A (mutant) at position 845. The CPs have a complementary C (wild-type) or T (mutant), respectively. A single signaling probe is complementary both targets. D: A genotyping chip was developed that contains capture probes perfectly matched to the wild-type or mutant allele with respect to the C282Y SNP in the Hfe gene. Amplicons were prepared from previously characterized genomic DNAs using A-PCR. Six electrode arrays were separately challenged with A-PCR products generated from homozygous wild-type genomic DNAs (WT-1 and WT-2), homozygous mutant genomic DNAs (Homo-1 and Homo-2), and heterozygous genomic DNAs (Hetero-1 and Hetero-2). The electrodes were interrogated at 25°C and again 1 minute after the hybridization chamber reached 50°C. The mean and SD of the peak faradaic current are reported after normalizing to the mean determined for each electrode type in each array at 25°C (defined as 100%). The ratio of the normalized means at the restrictive temperature is reported above the bars reporting the values at 50°C as wild-type/mutant. The values are derived from two electrodes of each type in each array. Electrodes modified with an unrelated DNA capture probe did not yield detectable faradaic current at any temperature.
Figure 4.
Figure 4.
An apoptosis gene-expression monitoring chip. A: An array was prepared containing electrodes modified with capture probes that are complementary to the human genes fas, p53, bax, p21, and bcl-2, as well as actin. Synthetic oligonucleotides were synthesized to serve as target mimics to validate and optimize the apoptosis gene-expression monitoring chip. Ferrocene-labeled signaling probes were also synthesized for each target. Fifty and 250 nm of the synthetic bcl-2 target mimic and its cognate signaling probe, respectively, were hybridized with the array for 1 hour at 25°C (t = 1 hour). All of the electrodes were interrogated, and the resulting current was recorded. Subsequently, a pool of the other target mimics and their signaling probes was applied, hybridization was continued for another hour, and the electrodes were once again interrogated by AC voltammetry and the resulting current recorded (t = 2 hours). Each bar represents the mean and SD observed for two electrodes in the array. B: The electrode array described in A was challenged first with the bax synthetic target mimic and signaling probe and subsequently the entire pool of the target mimics and their cognate signaling oligonucleotides. The array was analyzed as in A. C: A fas amplicon was obtained through RT-A-PCR with fas-specific primers using total human lymphocyte RNA. The amplicon was placed in hybridization solution along with its cognate signaling probe and incubated overnight in the hybridization chamber of an electrode array identical to the one described in A. D: A p53 amplicon was obtained through RT-A-PCR using p53-specific primers. The apoptosis gene-expression electrode array was challenged with the amplicon and its cognate signaling probe and analyzed as in A. E:fas and GAPDH amplicons were generated through RT-A-PCR and analyzed in the presence of both cognate signaling probes simultaneously, as in A.
Figure 1.
Figure 1.
Electrochemical detection of nucleic acids on the bioelectronic sensor using a sandwich assay. A: Schematic diagram of the sandwich assay for electronic detection of nucleic acids. The gold electrode is coated with a self-assembled monolayer (SAM) that includes (1) DNA-alkanethiols containing the capture probe sequence (one shown for simplicity), (2) thiol-terminated oligophenylethynyl molecules, also called molecular wires, and (3) alkanethiols terminated in polyethylene glycol insulator. The molecular wires provide a pathway for electron transfer between the ferrocenes and the gold in response to potential changes at the electrode. The alkanethiols terminated in ethylene glycol serve as insulators to block access of redox species in solution to the electrode, including free signaling probes. A target nucleic acid is shown annealed to a capture probe and a ferrocene-labeled signaling probe. B: Scheme depicting electrochemical oxidation of a ferrocene-labeled adenosine derivative from Fe(II) to Fe(III). Interfacial electron transfer from ferrocene to the gold electrode is detected as faradaic current. C: A representative voltammogram is shown. An electrode array was prepared with capture probes complementary to HIV or HCV. A 1-μmol/L solution of HIV target mimic and 2.5 μmol/L of both the HIV and HCV signaling probes were introduced into the hybridization chamber. After 1 minute of hybridization, an electrode modified with HIV capture probes was interrogated by AC voltammetry and the output current was recorded (solid line). An electrode modified with HCV capture probes was interrogated immediately afterward, and the output current was recorded (dashed line). Automated software has been developed to measure the peak height of the faradaic current relative to the baseline capacitive current. The peak height in the example shown is approximately 120 nA (310 nA peak −190 nA capacitive current = 120 nA, at the center). The faradaic current is recorded as a peak with a center at approximately 175 mV, coincident with the redox potential of ferrocene relative to the Ag/AgCl reference electrode.

References

    1. Abramowitz S: DNA Analysis in microfabricated formats. J Biomed Dev 1999, 1:107-112 - PubMed
    1. Zhang MQ: Large-scale gene expression data analysis: a new challenge to computational biologists. Genome Res 1999, 9:681-688 - PubMed
    1. Hacia JG, Collins FS: Mutational analysis using oligonucleotide microarrays. J Med Genet 1999, 36:730-736 - PMC - PubMed
    1. Farkas DH: Bioelectronic detection of DNA and the automation of mol diagnostics. J Assoc Lab Automat 1999, 4:20-24
    1. Creager S, Yu CJ, Bamdad C, O’Connor S, MacLean T, Lam E, Chong Y, Olsen GT, Luo J, Gozin M, Kayyem JF: Electron transfer at electrodes through conjugated “molecular wire” bridges. J Am Chem Soc, 1999, 121:1059–1064

MeSH terms

LinkOut - more resources