. 2001 Jun;75(11):5302-14.
doi: 10.1128/JVI.75.11.5302-5314.2001.

Polyomavirus small t antigen prevents retinoic acid-induced retinoblastoma protein hypophosphorylation and redirects retinoic acid-induced G0 arrest and differentiation to apoptosis

Affiliations

Polyomavirus small t antigen prevents retinoic acid-induced retinoblastoma protein hypophosphorylation and redirects retinoic acid-induced G0 arrest and differentiation to apoptosis

A Yen et al. J Virol. 2001 Jun.

Abstract

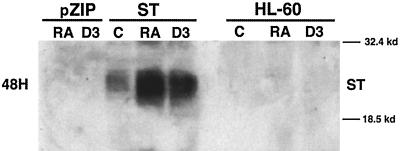
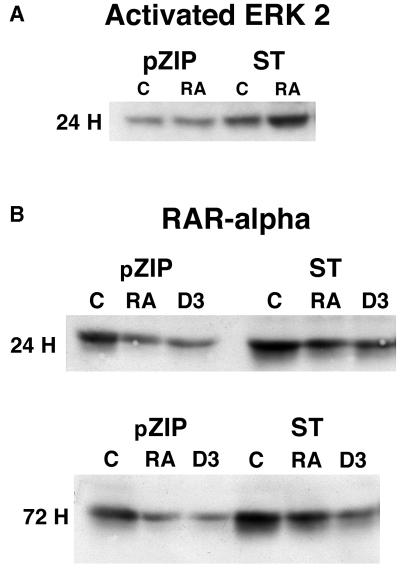
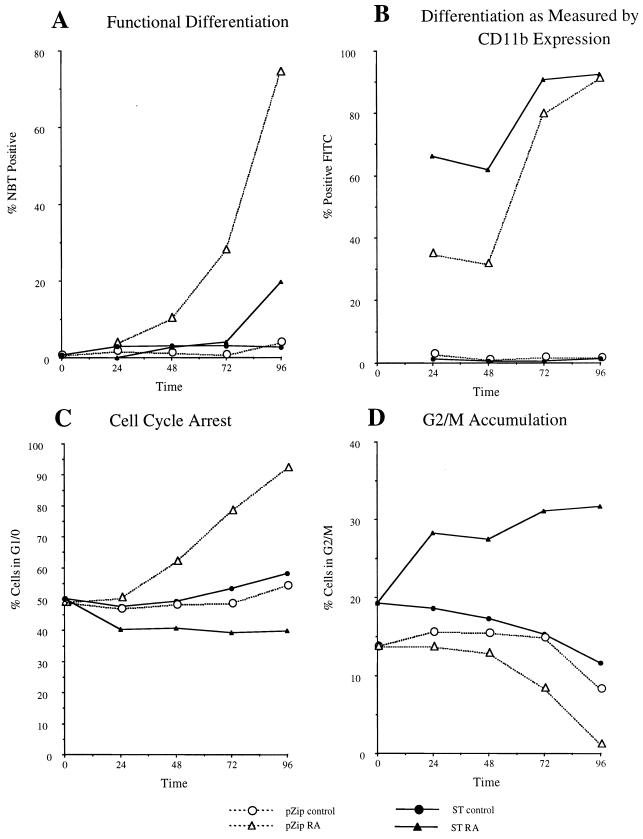
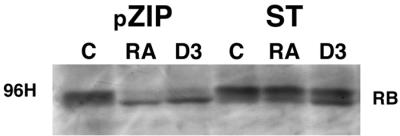
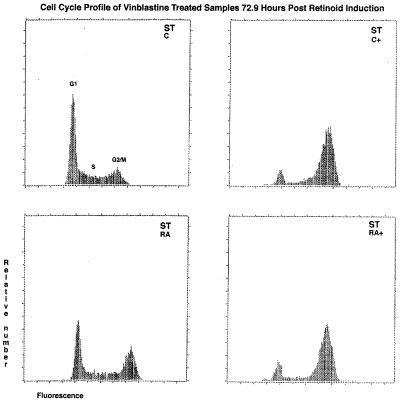
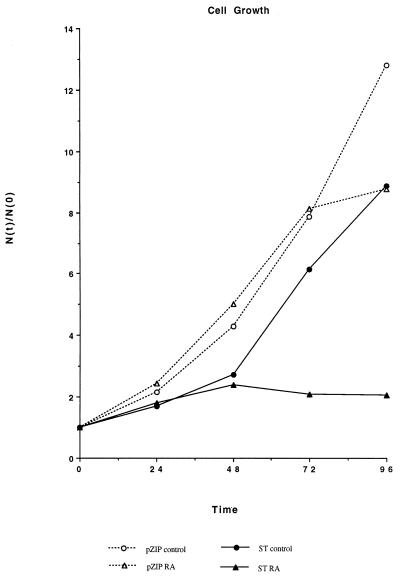
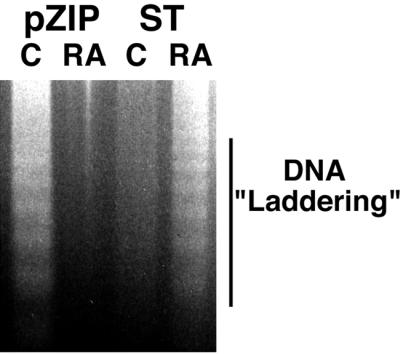
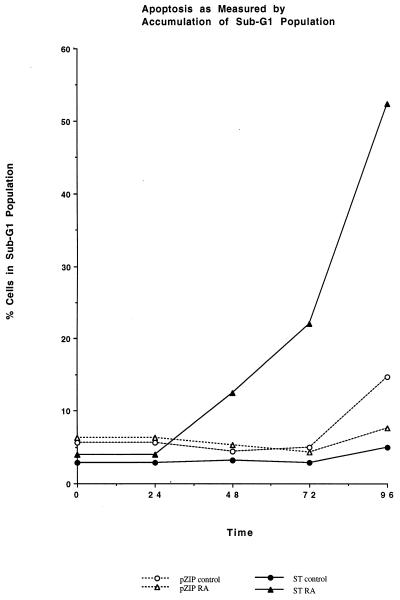
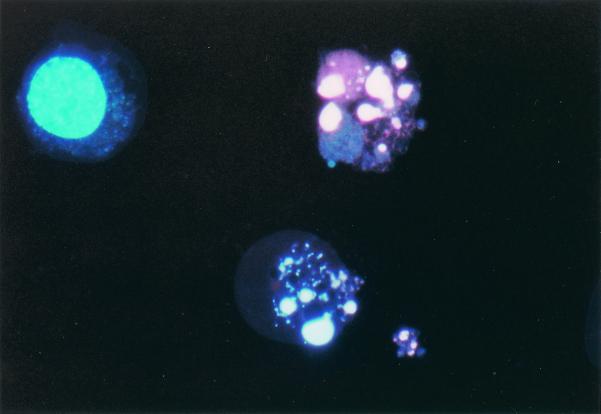
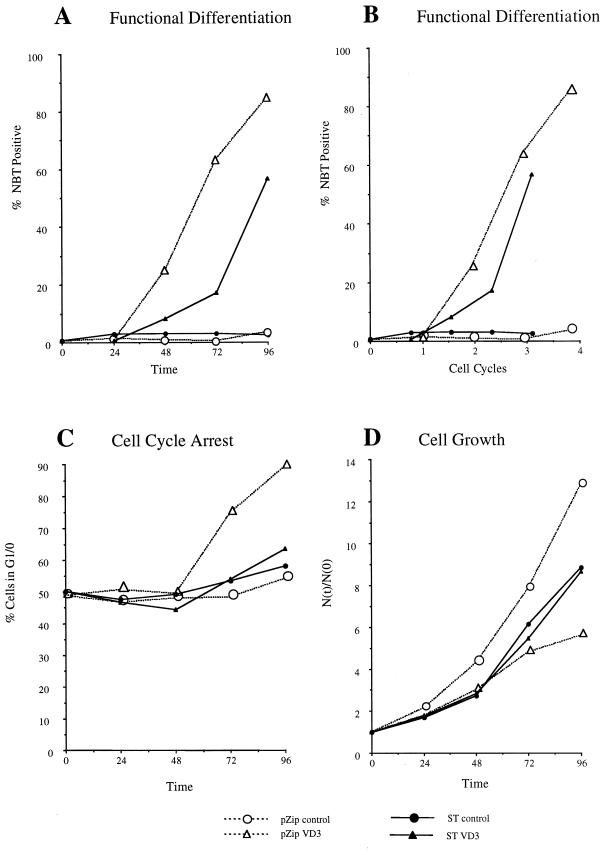
Polyomavirus small t antigen (ST) impedes late features of retinoic acid (RA)-induced HL-60 myeloid differentiation as well as growth arrest, causing apoptosis instead. HL-60 cells were stably transfected with ST. ST slowed the cell cycle, retarding G2/M in particular. Treated with RA, the ST transfectants continued to proliferate and underwent apoptosis. ST also impeded the normally RA-induced hypophosphorylation of the retinoblastoma tumor suppressor protein consistent with failure of the cells to arrest growth. The RA-treated transfectants expressed CD11b, an early cell surface differentiation marker, but inducible oxidative metabolism, a later and more mature functional differentiation marker, was largely inhibited. Instead, the cells underwent apoptosis. ST affected significant known components of RA signaling that result in G0 growth arrest and differentiation in wild-type HL-60. ST increased the basal amount of activated ERK2, which normally increases when wild-type cells are treated with RA. ST caused increased RARalpha expression, which is normally down regulated in RA-treated wild-type cells. The effects of ST on RA-induced myeloid differentiation did not extend to monocytic differentiation and G0 arrest induced by 1,25-dihydroxy vitamin D3, whose receptor is also a member of the steroid-thyroid hormone superfamily. In this case, ST abolished the usually induced G0 arrest and retarded, but did not block, differentiation without inducing apoptosis, thus uncoupling growth arrest and differentiation. In sum, the data show that ST disrupted the normal RA-induced program of G0 arrest and differentiation, causing the cells to abort differentiation and undergo apoptosis.


Figures

FIG. 1
FIG. 1
Ectopic expression of polyomavirus ST. Western blot of polyomavirus ST expression in vector control (pZIP) or small t (ST) stable transfectants and wild-type (parental) HL-60 cells in the absence (C) or presence of 10−6 M retinoic acid (RA) or 0.5 × 10⁻⁶ M 1,25-dihydroxy vitamin D3 (D3) is shown. RA or D3 treatment was for 48 h. Only the ST transfectants expressed the small t antigen, and expression was enhanced by RA or D3 because expression of the ST cDNA was under the control of MMLV LTRs.
FIG. 2
FIG. 2
Effect of ST on signaling molecules involved with retinoic acid. (A) Western blot of activated ERK2 for vector control (pZIP) or small t (ST) stable transfectants that were untreated (C) or treated (RA) with retinoic acid for 24 h. (B) Western blot of RARα for vector control (pZIP) or small t (ST) stable transfectants that were untreated (C) or treated with retinoic acid (RA) or 1,25-dihydroxy vitamin D3 (D3) for 24 or 72 h.
FIG. 3
FIG. 3
Effect of ST on RA-induced differentiation and cell cycle arrest. (A) Functional differentiation measured by the percentage of cells able to reduce nitroblue tetrazolium (NBT) as a function of time (in hours) in culture in the absence (circle) or presence (triangle) of retinoic acid for vector control (open symbol) or ST (closed symbol) transfectants. (B) Differentiation measured by the percentage of cells expressing the CD11b cell surface differentiation marker as a function of time (in hours) in culture in the absence (circle) or presence (triangle) of retinoic acid for vector control (open symbol) or ST (closed symbol) transfectants. Expression at zero hour was minimal, as shown for controls without RA. (C) Percentage of cells in G1/0 as a function of time (in hours) in culture in the absence (circle) or presence (triangle) of RA for vector control (open symbol) or ST (closed symbol) transfectants. G1/0 specific cell cycle arrest is evidenced by enrichment in the relative number of G1/0 DNA cells. The percentages are derived from DNA histograms of propidium iodide-stained cells using the flow cytometer computer as done previously (49). The fluorescence intensity of the G1 peak for ST and vector control transfectants in both treated and untreated cultures was indistinguishable from that of wild-type HL-60 or normal peripheral blood mononuclear cells, indicating that the total DNA content for G1/0 cells was approximately 2n and that there was no indication of potentially viral antigen-induced endoreduplication. (D) Percentage of cells in G2/M as a function of time (hours) in culture in the absence (circle) or presence (triangle) of retinoic acid for vector control (open symbol) or ST (closed symbol) transfectants. In ST transfectants treated with RA, the percentages of G2/M cells are increased compared to untreated cells, whereas vector control transfectants treated with RA decrease their percentages of G2/M cells compared to untreated cells.
FIG. 4
FIG. 4
Effect of ST on induced RB protein hypophosphorylation. Western blot of RB tumor suppressor protein for vector control (pZIP) or small t (ST) stable transfectants that were untreated (C) or treated with retinoic acid (RA) or 1,25-dihydroxy vitamin D3 (D3) for 96 h is shown. Phosphorylation of the RB protein retards its relative gel mobility, making the hypophosphorylated RB protein apparent as a faster-migrating band. RB in RA- or D3-treated ST transfectants failed to shift to the hypophosphorylated form characteristic of growth arrest.
FIG. 5
FIG. 5
Continued cell cycling of RA-treated ST transfectants. DNA histograms for small t transfectants (ST C, upper left), small t transfectants treated with vinblastine (ST C+, upper right), RA-treated small t transfectants (ST RA, lower left), and RA-treated small t transfectants treated with vinblastine (ST RA+, lower right). Cells were cultured for 48 h in the absence or presence of retinoic acid and then a further 24 h in the absence or presence of vinblastine to generate the four cases shown. The horizontal axis is propidium iodide fluorescence, which is proportional to nuclear DNA content, and the vertical axis is the relative number of cells. The left peak, labeled G1, represents cells with G1 DNA content, whereas the right peak, labeled G2/M, represents cells with G2/M DNA content. Cells with intermediate DNA content are in S phase. The DNA histograms show no evidence of virally induced endoreduplication by cells with greater than 4n DNA content.
FIG. 6
FIG. 6
Inhibited numerical population growth of RA-treated ST transfectants. Relative cell density [N(t)/N(0)], cell density at time t divided by initial cell density at time zero hour, as a function of time (in hours) in culture in the absence (circle) or presence (triangle) of retinoic acid for vector control (open symbol) or ST (closed symbol) transfectants is shown. Cell density of RA-treated ST transfectants reaches a plateau after approximately one doubling.
FIG. 7
FIG. 7
Apoptotic DNA laddering in RA-treated ST transfectants. Ethidium bromide-stained agarose gel resolving DNA from high-density vector control transfectants (pZIP) that were untreated (C) (lane 1), vector control transfectants treated with RA (RA) for 96 h (lane 2), small t transfectants (ST) that were untreated (C) (lane 3), ST transfectants treated with RA (RA) for 96 h (lane 4). ST transfectants treated with RA showed DNA laddering characteristic of apoptosis. High-density nutritionally compromised vector control transfectants (lane 1) were used as a positive control for apoptosis. These cells were deliberately induced to undergo apoptosis by not being fed or recultured for a week. However, nutritional insufficiency could not be responsible for the apoptosis of RA-treated ST cells, since the control ST cells and RA-treated pZIP vector control cells were at higher density (Fig. 6) but without apoptosis.
FIG. 8
FIG. 8
Apoptotic sub-G1 DNA cells. Apoptosis was measured by the percentage of cells with sub-G1 DNA as a function of time (in hours) in culture in the absence (circle) or presence (triangle) of RA for vector control (open symbol) or ST (closed symbol) transfectants. ST transfectants treated with RA showed accumulation of sub-G1 cells, indicating apoptosis. No accumulation was induced in vector control cells except for a small increase at the latest time point for untreated controls, which, unlike RA-treated cells, continued to proliferate and reached a high cell density severalfold greater than RA-treated cells.
FIG. 9
FIG. 9
Apoptotic cytology. Apoptosis of RA-treated ST-transfected HL-60 cells can be detected cytologically. Two cells show condensed, segregated chromatin revealed by Hoechst 33342 staining. The third cell is viable and shows a normal nucleus, stained with Hoechst 33342 but not propidium iodide, which the viable cell excludes. ST transfectants treated with RA showed accumulation of apoptotic cells, whereas untreated ST transfectants and vector control cells did not.
FIG. 10
FIG. 10
Effects of ST on D3-induced differentiation and cell cycle arrest. (A) Functional differentiation measured by the percentage of cells able to reduce nitroblue tetrazolium (NBT) as a function of time (in hours) in culture in the absence (circle) or presence (triangle) of 1,25-dihydroxy vitamin D3 for vector control (open symbol) or ST (closed symbol) transfectants. (B) Functional differentiation measured by the percentage of cells able to reduce nitroblue tetrazolium (NBT) as a function of time (measured in cell cycle durations specific for the cell line) in culture in the absence (circle) or presence (triangle) of 1,25-dihydroxy vitamin D3 for vector control (open symbol) or ST (closed symbol) transfectants. (C) Percentage of cells in G1/0 as a function of time (in hours) in culture in the absence (circle) or presence (triangle) of 1,25-dihydroxy vitamin D3 for vector control (open symbol) or ST (closed symbol) transfectants. G1/0, specific cell cycle arrest is evidenced by enrichment in the relative number of G1/0 DNA cells. Flow cytometric DNA histograms showed no evidence of endoreduplication in any of the cultures. (D) Relative cell density [N(t)/N(0)], cell density at time t divided by initial cell density at time zero hour, as a function of time (in hours) in culture in the absence (circle) or presence (triangle) of 1,25-dihydroxy vitamin D3 for vector control (open symbol) or ST (closed symbol) transfectants. Growth of 1,25-dihydroxy vitamin D3-treated vector control transfectants was inhibited relative to that of untreated ones, but growth of 1,25-dihydroxy vitamin D3-treated ST transfectants was not inhibited relative to that of untreated ST transfectants.

Similar articles

Cited by

References

    1. Asselin C, Gelinas C, Bastin M. Role of the three polyomavirus early proteins in tumorigenesis. Mol Cell Biol. 1983;3:1451–1459. - PMC - PubMed
    1. Asselin C, Vass-Marengo J, Bastin M. Mutation in the polyomavirus genome that activates the properties of large T associated with neoplastic transformation. J Virol. 1986;57:165–172. - PMC - PubMed
    1. Battle T, Levine R A, Yen A. Retinoic acid-induced blr1 expression promotes ERK2 activation and cell differentiation in HL-60 cells. Exp Cell Res. 2000;254:287–298. - PubMed
    1. Battle T E, Roberson M S, Zhang T, Varvayanis S, Yen A. Retinoic acid-induced blr1 expression requires RARα, RXR, and MAPK activation and uses ERK2 but not JNK/SAPK to accelerate cell differentiation. Eur J Cell Biol. 2000;80:59–67. - PubMed
    1. Berger H, Wintersberger E. Polyomavirus small T antigen enhances replication of viral genomes in 3T6 mouse fibroblasts. J Virol. 1986;60:768–770. - PMC - PubMed

Publication types

MeSH terms