Comparative Study
. 2001 May;11(5):754-70.
doi: 10.1101/gr.177001.

The basic helix-loop-helix protein family: comparative genomics and phylogenetic analysis

Affiliations
Comparative Study

The basic helix-loop-helix protein family: comparative genomics and phylogenetic analysis

V Ledent et al. Genome Res. 2001 May.

Abstract

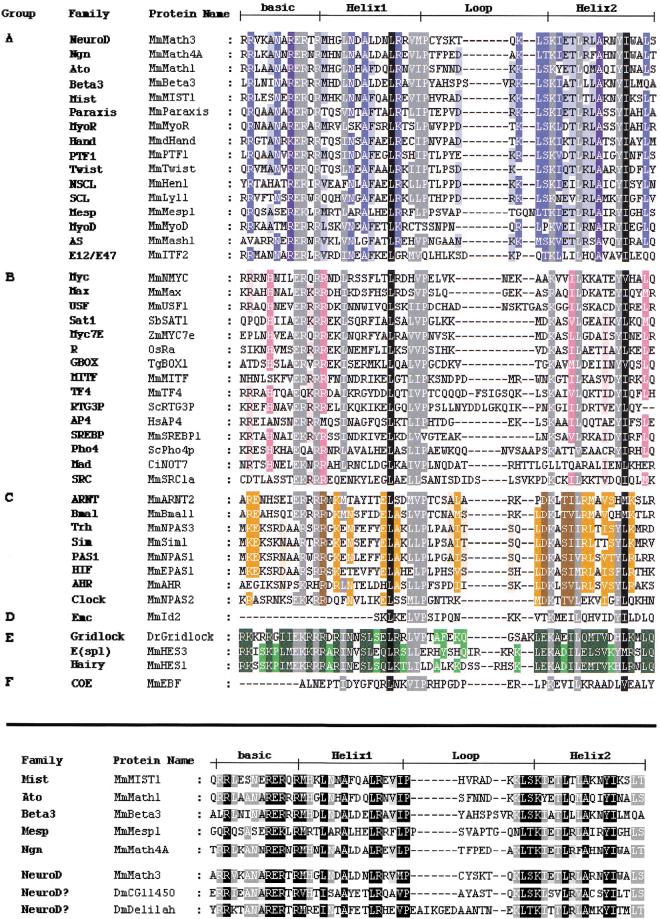
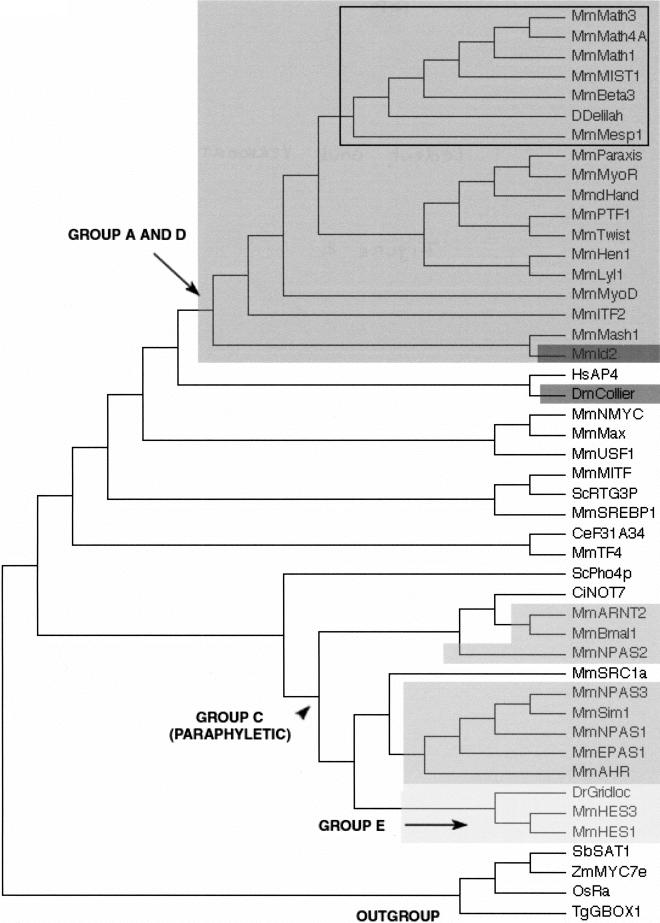
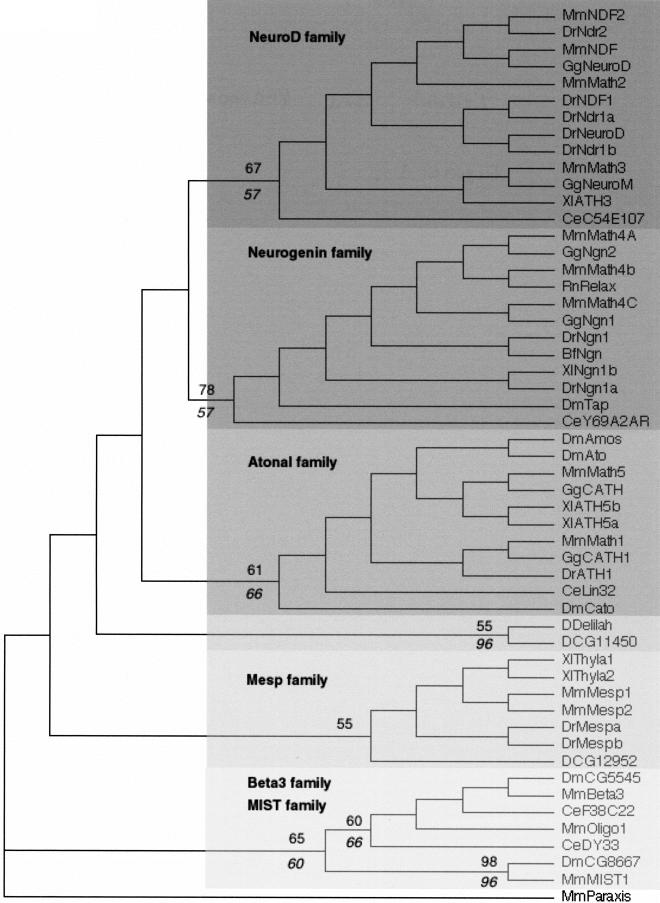
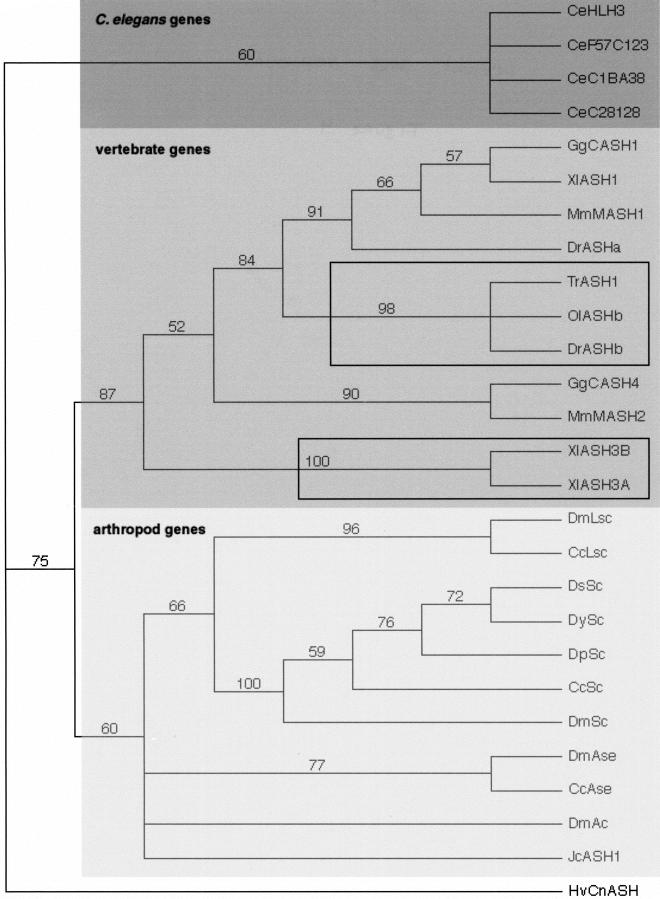
The basic Helix-Loop-Helix (bHLH) proteins are transcription factors that play important roles during the development of various metazoans including fly, nematode, and vertebrates. They are also involved in human diseases, particularly in cancerogenesis. We made an extensive search for bHLH sequences in the completely sequenced genomes of Caenorhabditis elegans and of Drosophila melanogaster. We found 35 and 56 different genes, respectively, which may represent the complete set of bHLH of these organisms. A phylogenetic analysis of these genes, together with a large number (>350) of bHLH from other sources, led us to define 44 orthologous families among which 36 include bHLH from animals only, and two have representatives in both yeasts and animals. In addition, we identified two bHLH motifs present only in yeast, and four that are present only in plants; however, the latter number is certainly an underestimate. Most animal families (35/38) comprise fly, nematode, and vertebrate genes, suggesting that their common ancestor, which lived in pre-Cambrian times (600 million years ago) already owned as many as 35 different bHLH genes.


Figures

Figure 1
Figure 1
(top) Alignment of the bHLH of the 44 different families listed in Table 1 (abbreviations as in Table 1). One member per family, usually from mouse, has been selected. Designation of basic, Helix1, Loop and Helix2 follows Ferre-D'Amare et al. (1993). The different families have been grouped according to the high-order group to which they belong (Atchley and Fitch 1997; see text). The evaluation of percentage conservation within each group and through the complete multiple sequence alignment was done using the Blosum62 Similarity Scoring Table. A specific background color with three intensities is attributed to each group (dark, 100% conservation; medium, 80% or greater conserved; light, 60% or greater conserved). Dark gray and black backgrounds represent conservation through all groups. Residues with black background represent 100% conservation; residues with dark gray background represent 80% or greater conservation. (bottom) Alignment of the bHLH of the constituting members of the Atonal superfamily. One member of each family plus the two orphan Drosophila genes, CG11450 and delilah are represented. The evaluation of percentage conservation was done using the Blosum62 Similarity Scoring Table. Background intensities represent conservation (dark, 100% conservation; medium 80% or greater conserved; light, 60% or greater conserved). In this and all subsequent figures, the following abbreviations for species names are used: Bb, Branchiostoma belcheri (amphioxus); Bf, Branchiostoma floridae (amphioxus); Cc, Ceratitis capitata (a lower diptera); Ce, Caenorhabditis elegans; Ci, Ciona intestinalis (an ascidian); D and Dm, Drosophila melanogaster; Dp, Drosophila pseudoobscura; Dr, (Brachy)danio rerio (zebrafish); Ds, Drosophila simulans; Dy, Drosophila yakuba; Gg, Gallus gallus (chick); Hs, Homo sapiens; Hv, Hydra vulgaris; Jc, Juonia coenia (buckeye butterfly); Mm, Mus musculus; Ol, Oryzias latipes (Japanese medaka); Os, Oryza sativa (rice); Rn, Rattus norvegicus; Sb, Soybean (Glycina max); Sc, Saccharomyces cerevisiae (yeast); Tg, Tulipa gesneriana; Tr, Takifugu rubripes (pufferfish); Xl, Xenopus laevis; Zm, Zea mays (maize).
Figure 2
Figure 2
A neighbor-joining (NJ) tree showing the evolutionary relationships of the 44 bHLH families listed in Table 1 as well as the orphan genes delilah (putative D. melanogaster neuroD gene) and F31A3.4 (as a representative of a group of three C. elegans genes that cluster together with high bootstrap value; see Table 3). We used one gene (usually from mouse) per family to construct this tree. Although there are strong theoretical reasons for preferring the unrooted tree, we show a rooted tree because it is easier to display compactly and more clearly represents the relationships at the tip of the branches. This tree is just a representation of an unrooted tree with rooting that should be considered arbitrary. We used the four plant bHLH families as outgroup. For similar sake of simplicity, we show a tree in which branch lengths are not proportional to distances between sequences. A tree with meaningful branch lengths can be found at http://www.cnrs-gif.fr/cgm/evodevo/bhlh/index.html. The two monophyletic high-order groups A + D (large, dark-gray box and arrows) and E (very light-gray box) are highlighted. The Emc family (the high-order group D of Atchley and Fitch 1997; represented in our tree by Mm Id2) is shown in a black box and the group F (COE family) in a dark gray box. The bHLH-PAS families (the high-order group D of Atchley and Fitch 1997) are shown in intermediate gray boxes. Their last common ancestor (arrowhead) is also that of non bHLH-PAS families and the group is hence paraphyletic. Finally, all the other families were included in the high-order group B of Atchley and Fitch (1997), a group that appears to be paraphyletic (the common ancestor of these families is that of all bHLH genes). The Atonal superfamily is pointed out (black square) and is detailed in Figure 3. Abbreviations are as listed in Figure 1. The alignment on which this tree is based and complementary phylogenetic analyses are available at http://www.cnrs-gif.fr/cgm/evodevo/bhlh/index.html.
Figure 3
Figure 3
A rooted neighbor-joining (NJ) tree showing the evolutionary relationships of Atonal superfamily members. We used the closely related paraxis sequence (see Figure 2) as outgroup. The different constituting families are pointed out. Numbers above branches indicate percent support for the nodes defining the families in distance bootstrap analyses (1000 replicates). Italicized numbers below branches indicate percent reliability in a puzzle maximum-likelihood (ML) tree. The Mesp family is not supported by ML analyses. Deep nodes are not supported by resampling methods. Note that delilah and CG11450 cluster together but are not associated to any vertebrate or nematode genes. As in Figure 2, the tree shown has branch lengths that are not proportional to distance between sequences. The alignments of which this tree is based as well as maximum parsimony (MP), ML, phylogram, and bootstrapped trees can be found at http://www.cnrs-gif.fr/cgm/evodevo/bhlh/index.html. Abbreviations are as listed in Figure 1.
Figure 4
Figure 4
A neighbor-joining (NJ) tree showing the evolutionary relationships among Achaete-Scute family members. Numbers above branches indicate percent support in bootstrap analyses (1000 replicates). This tree is rooted using the single cnidarian (Hv CNASH) member as outgroup. As in Figure 3, the rooting should be considered arbitrary. The four fly achaete-scute genes are collectively orthologous to the four worm genes and to two subfamilies of vertebrate genes, the MASH-1 and MASH-2 related genes, respectively. The three closely related actinopterygians sequences (TrASH1, OlASHB, and DrASHb) and the two closely related Xenopus sequences are pointed out (black squares). Note also the basal position of the Juonia coenia sequences (Jc ASH1), inside the arthropod clade, that indicates that this gene is most probably the single ortholog of the three or four achaete-scute genes found in diptera. The alignments of which this tree is based as well as maximum parsimony (MP), maximum likelihood (ML), phylogram, and bootstrapped trees can be found on our Web site. Abbreviations are as listed in Figure 1.

References

    1. Adams MD, et al. The genome sequence of Drosophila melanogaster. Science. 2000;287:2185–2195. - PubMed
    1. Adoutte A, Balavoine G, Lartillot N, Lespinet O, Prud'homme B, de Rosa R. The new animal phylogeny: Reliability and implications. Proc Natl Acad Sci. 2000;97:4453–4456. - PMC - PubMed
    1. Aguinaldo AMA, Turbeville JM, Linford LS, Rivera MC, Garey JR, Raff RA, Lake JA. Evidence for a clade of nematodes, arthropods and other moulting animals. Nature. 1997;387:489–493. - PubMed
    1. Altschul SF, Gish W, Miller W, Myers EW, Lipman DJ. Basic local alignment search tool. J Mol Biol. 1990;215:403–410. - PubMed
    1. Arendt D, Nübler-Jung K. Comparisons of early nerve cord development in insects and vertebrates. Development. 1999;126:2309–2325. - PubMed

Publication types

MeSH terms

LinkOut - more resources