

Genomic anatomy of a premier major histocompatibility complex paralogous region on chromosome 1q21-q22
- PMID: 11337475
- PMCID: PMC311078
- DOI: 10.1101/gr.175801
Genomic anatomy of a premier major histocompatibility complex paralogous region on chromosome 1q21-q22
Abstract
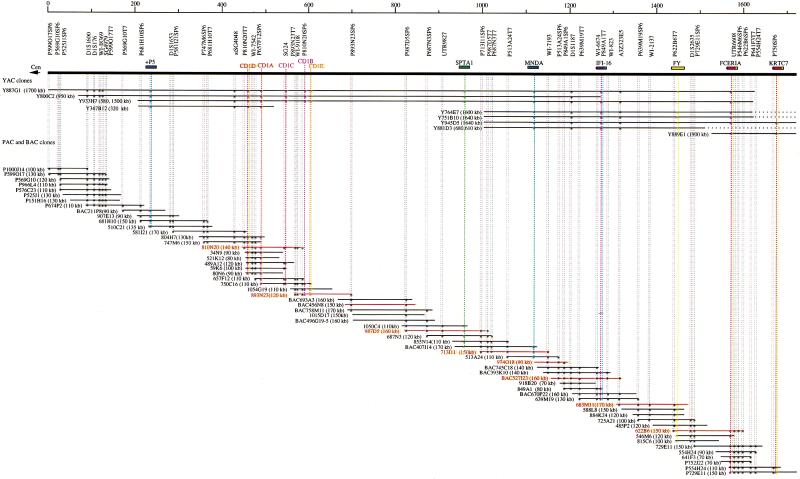
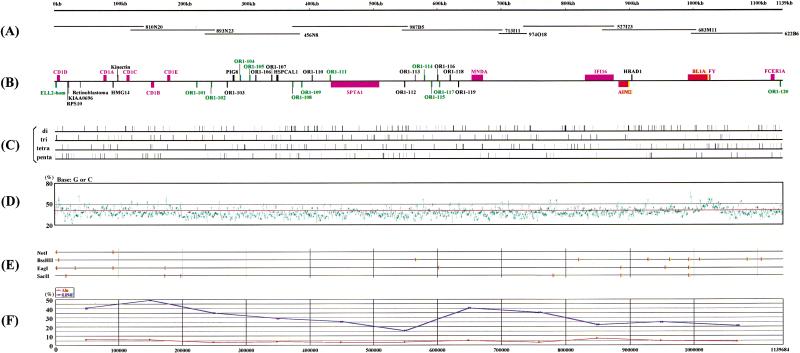
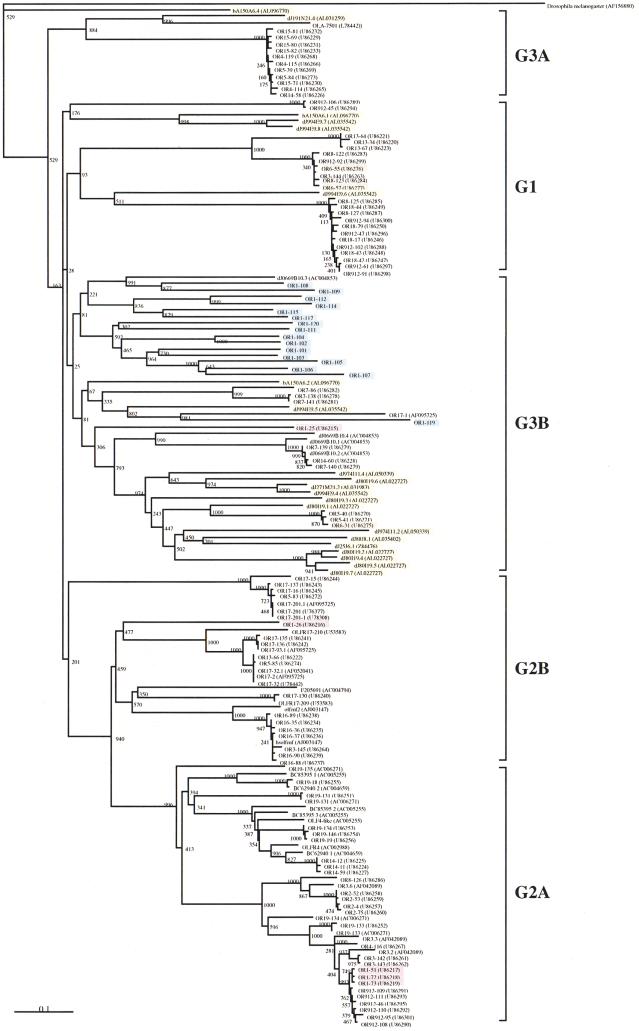
Human chromosomes 1q21-q25, 6p21.3-22.2, 9q33-q34, and 19p13.1-p13.4 carry clusters of paralogous loci, to date best defined by the flagship 6p MHC region. They have presumably been created by two rounds of large-scale genomic duplications around the time of vertebrate emergence. Phylogenetically, the 1q21-25 region seems most closely related to the 6p21.3 MHC region, as it is only the MHC paralogous region that includes bona fide MHC class I genes, the CD1 and MR1 loci. Here, to clarify the genomic structure of this model MHC paralogous region as well as to gain insight into the evolutionary dynamics of the entire quadriplication process, a detailed analysis of a critical 1.7 megabase (Mb) region was performed. To this end, a composite, deep, YAC, BAC, and PAC contig encompassing all five CD1 genes and linking the centromeric +P5 locus to the telomeric KRTC7 locus was constructed. Within this contig a 1.1-Mb BAC and PAC core segment joining CD1D to FCER1A was fully sequenced and thoroughly analyzed. This led to the mapping of a total of 41 genes (12 expressed genes, 12 possibly expressed genes, and 17 pseudogenes), among which 31 were novel. The latter include 20 olfactory receptor (OR) genes, 9 of which are potentially expressed. Importantly, CD1, SPTA1, OR, and FCERIA belong to multigene families, which have paralogues in the other three regions. Furthermore, it is noteworthy that 12 of the 13 expressed genes in the 1q21-q22 region around the CD1 loci are immunologically relevant. In addition to CD1A-E, these include SPTA1, MNDA, IFI-16, AIM2, BL1A, FY and FCERIA. This functional convergence of structurally unrelated genes is reminiscent of the 6p MHC region, and perhaps represents the emergence of yet another antigen presentation gene cluster, in this case dedicated to lipid/glycolipid antigens rather than antigen-derived peptides.
Figures
References
-
- Abi-Rached L, McDermott MF, Pontarotti P. The MHC big bang. Immunol Rev. 1999;167:33–44. - PubMed
-
- Altschul SF, Gish W, Miller W, Myers EW, Lipman D J. Basic local alignment search tool. J Mol Biol. 1990;215:403–410. - PubMed
-
- Balk SP, Bleicher PA, Terhorst C. Isolation and expression of cDNA encoding the murine homologues of CD1. J Immunol. 1991;146:768–774. - PubMed
Publication types
MeSH terms
Substances
Associated data
- Actions
- Actions
- Actions
- Actions
- Actions
- Actions
- Actions
- Actions
- Actions
LinkOut - more resources
Full Text Sources
Research Materials
Miscellaneous