Comparative Study
. 2001 May;11(5):803-16.
doi: 10.1101/gr.175701.

Computational inference of homologous gene structures in the human genome

Affiliations
Comparative Study

Computational inference of homologous gene structures in the human genome

R F Yeh et al. Genome Res. 2001 May.

Abstract

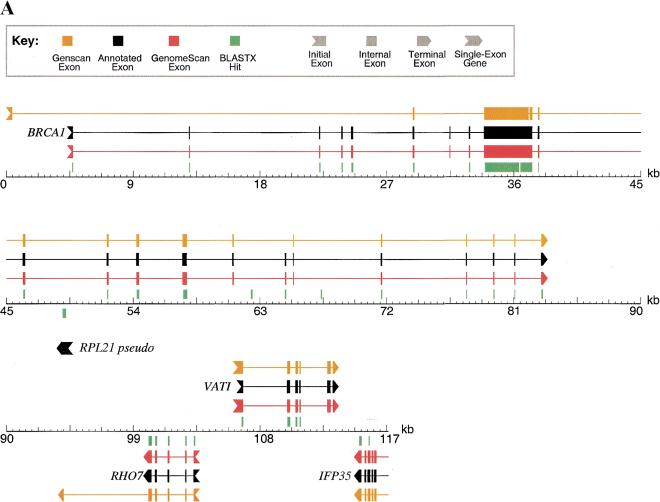
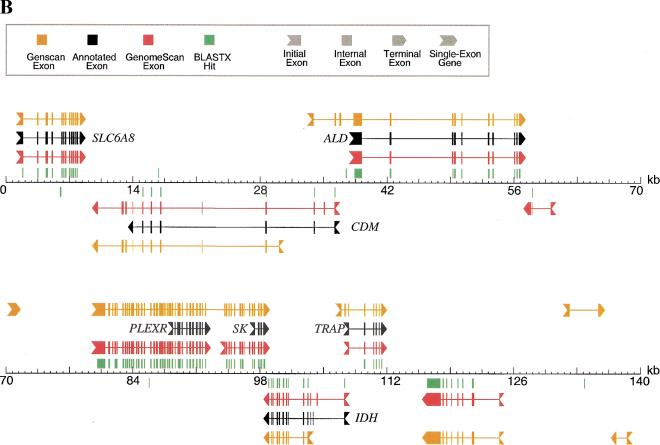
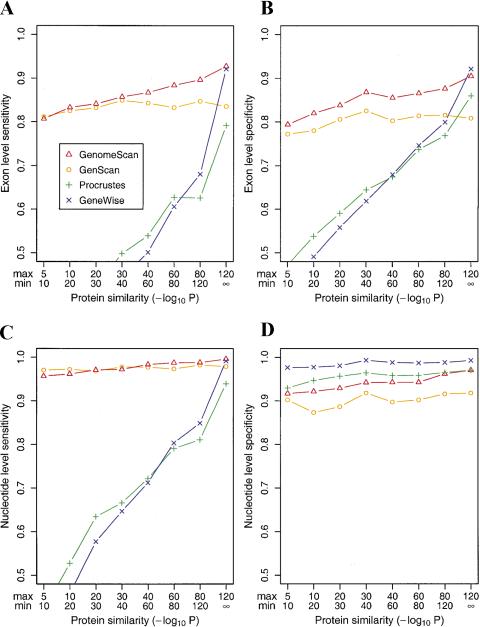
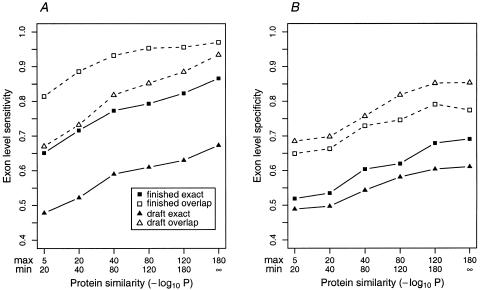
With the human genome sequence approaching completion, a major challenge is to identify the locations and encoded protein sequences of all human genes. To address this problem we have developed a new gene identification algorithm, GenomeScan, which combines exon-intron and splice signal models with similarity to known protein sequences in an integrated model. Extensive testing shows that GenomeScan can accurately identify the exon-intron structures of genes in finished or draft human genome sequence with a low rate of false-positives. Application of GenomeScan to 2.7 billion bases of human genomic DNA identified at least 20,000-25,000 human genes out of an estimated 30,000-40,000 present in the genome. The results show an accurate and efficient automated approach for identifying genes in higher eukaryotic genomes and provide a first-level annotation of the draft human genome.


Figures

Figure 1
Figure 1
Examples of GenomeScan predictions. GenomeScan was run with GenomeScript, using similarity to available mouse proteins from GenPept Release 118 (June 2000). Two examples are shown. Exons and genes on the forward strand are shown above the sequence line; reverse strand exons and genes are shown below the sequence line. BLASTX hits with P < 0.05 are shown as green blocks above or below the sequence line, according to the reading frame/strand indicated by BLAST. (A) GenBank locus HUMBRCA1 (accession no. L78833). (B) GenBank locus HSU52111 (accession no. U52111). Only the first 140 kbp (of 153 kbp) of the sequence is shown for clarity. The extra predicted exons upstream of PLEXR and SK and the extra predicted gene at ∼118 kb are supported by several human ESTs (accession nos. AW663636, AA514687, AW071821, and others).
Figure 1
Figure 1
Examples of GenomeScan predictions. GenomeScan was run with GenomeScript, using similarity to available mouse proteins from GenPept Release 118 (June 2000). Two examples are shown. Exons and genes on the forward strand are shown above the sequence line; reverse strand exons and genes are shown below the sequence line. BLASTX hits with P < 0.05 are shown as green blocks above or below the sequence line, according to the reading frame/strand indicated by BLAST. (A) GenBank locus HUMBRCA1 (accession no. L78833). (B) GenBank locus HSU52111 (accession no. U52111). Only the first 140 kbp (of 153 kbp) of the sequence is shown for clarity. The extra predicted exons upstream of PLEXR and SK and the extra predicted gene at ∼118 kb are supported by several human ESTs (accession nos. AW663636, AA514687, AW071821, and others).
Figure 2
Figure 2
Exon- and nucleotide-level accuracy of similarity-based gene-prediction programs as a function of protein similarity. (A) Exon-level sensitivity (ESn: percent of exons predicted exactly) and (B) exon-level specificity (ESp: percent of predicted exons exactly correct) were calculated for subsets of the SingleGene dataset and grouped according to the level of BLASTP similarity (in the context of a database search) between the encoded protein and the protein used in the prediction for GenomeScan, Procrustes, and GeneWise as described by Guigó et al. 2000). The definitions of the subsets and number of genes per subset were as follows: 10−5 > P >10−10 (90); 10−10 > P > 10−20 (103); 10−20 > P >10−30 (102); 10−30 > P > 10−40 (97); 10−40 > P >10−60 (114); 10−60 > P > 10−80 (97); 10−80 > P > 10−120 (97); and P < 10−120 (72). For example, 114 of the 175 sequences in the SingleGene dataset had a homolog with BLAST P-value in the range 10−60< P < 10−40. For sequences in this subset, GenomeScan was run using the results of a BLASTX run of the genomic sequence against the top hit in the nonredundant protein database that had sequence similarity in the desired range (10−40 > P > 10−60). GeneWise and Procrustes data, run using the same peptides as input, are from Guigó et al. (2000). (C) Nucleotide-level sensitivity (NSn: percent of coding nucleotides predicted correctly) and (D) nucleotide-level specificity (NSp: percent of predicted coding nucleotides that are correct). Accuracy statistics on the SingleGene dataset as a whole for the ab initio gene-prediction methods GENSCAN, HMMGene 1.1, and GRAIL 3.1, respectively, were as follows: ESn (0.79, 0.75, 0.47); ESp (0.77, 0.68, 0.61); NSn (0.93, 0.86, 0.68): NSp (0.91, 0.74, 0.94).
Figure 3
Figure 3
Exon-level accuracy of GenomeScan as a function of protein similarity in draft and finished sequences. GenomeScan was run on subsets of the FinishGene and DraftGene datasets, grouped according to the level of similarity to the nearest proteins used in the predictions. (A) Exon-level sensitivity (percent of annotated exons predicted exactly) is displayed with solid squares/triangles and solid lines; overlap sensitivity (percent of annotated exons overlapped by a predicted exon) by open squares/triangles and dashed lines. (B) Exon-level specificity (percent of predicted exons exactly correct) is displayed with solid squares/triangles and solid lines. Overlap specificity (percent of predicted exons overlapped by an annotated exon) is displayed by open squares/triangles and broken lines. For comparison, overlap exon-level sensitivity and specificity values for GENSCAN + BLASTP (GENSCAN predictions that have a BLASTP hit with P < 10−5 against the nonredundant protein database) were 0.90 and 0.48, respectively, in the FinishGene dataset and 0.87 and 0.47, respectively, in the DraftGene dataset.

References

    1. Altschul SF, Madden TL, Schaffer AA, Zhang J, Zhang Z, Miller W, Lipman DJ. Gapped BLAST and PSI-BLAST: A new generation of protein database search programs. Nucleic Acids Res. 1997;25:3389–3402. - PMC - PubMed
    1. Batzoglou S, Pachter L, Mesirov JP, Berger B, Lander ES. Human and mouse gene structure: Comparative analysis and application to exon prediction. Genome Res. 2000;10:950–958. - PMC - PubMed
    1. Birney E, Durbin R. Using GeneWise in the Drosophilaannotation experiment. Genome Res. 2000;10:547–548. - PMC - PubMed
    1. Brenner V, Nyakatura G, Rosenthal A, Platzer M. Genomic organization of two novel genes on human Xq28: Compact head to head arrangement of IDH gamma and TRAP delta is conserved in rat and mouse. Genomics. 1997;44:8–14. - PubMed
    1. Burge CB. “Identification of genes in human genomic DNA.” Ph.D. thesis. California: Stanford University; 1997.

Publication types