Comparative Study
. 2001 May;11(5):850-62.
doi: 10.1101/gr.172701.

Human-ovine comparative sequencing of a 250-kb imprinted domain encompassing the callipyge (clpg) locus and identification of six imprinted transcripts: DLK1, DAT, GTL2, PEG11, antiPEG11, and MEG8

Affiliations
Comparative Study

Human-ovine comparative sequencing of a 250-kb imprinted domain encompassing the callipyge (clpg) locus and identification of six imprinted transcripts: DLK1, DAT, GTL2, PEG11, antiPEG11, and MEG8

C Charlier et al. Genome Res. 2001 May.

Abstract

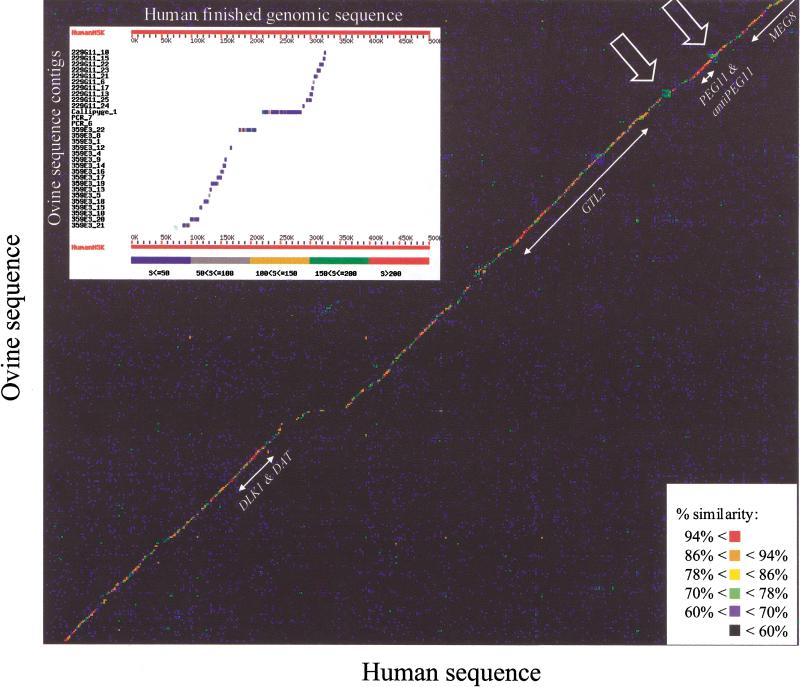
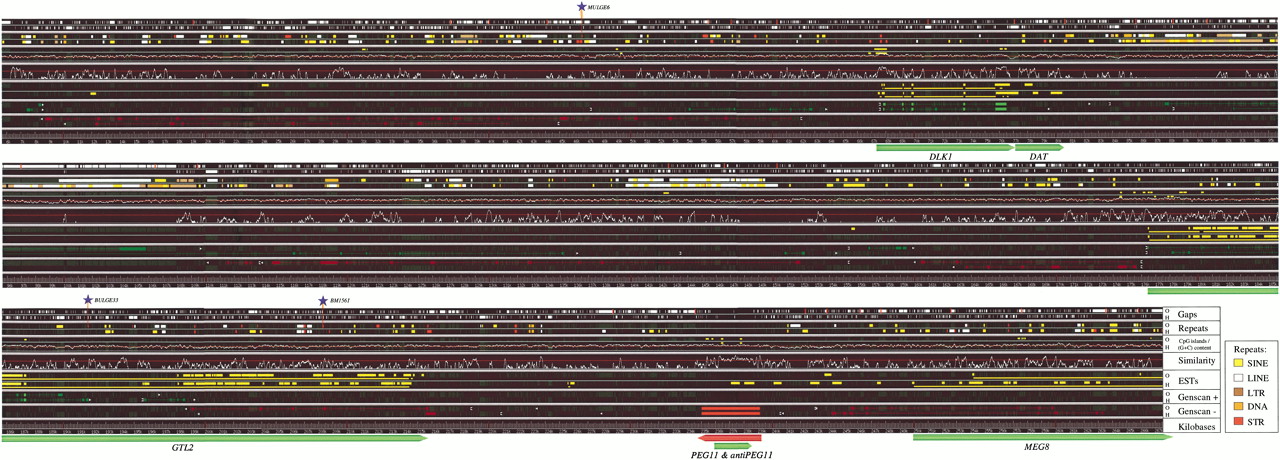
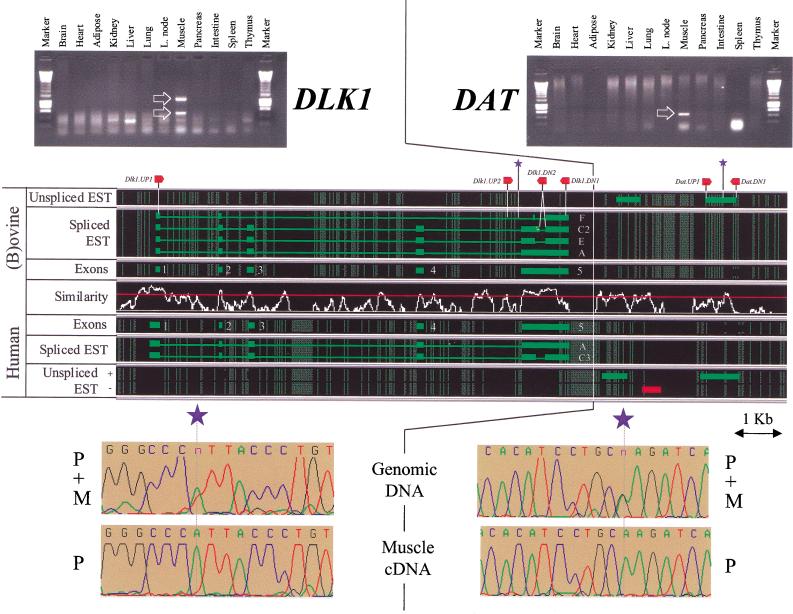
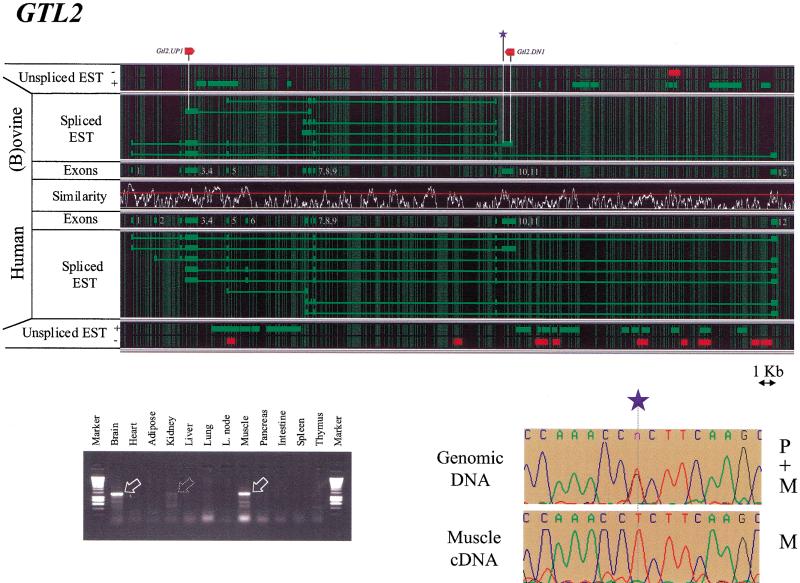
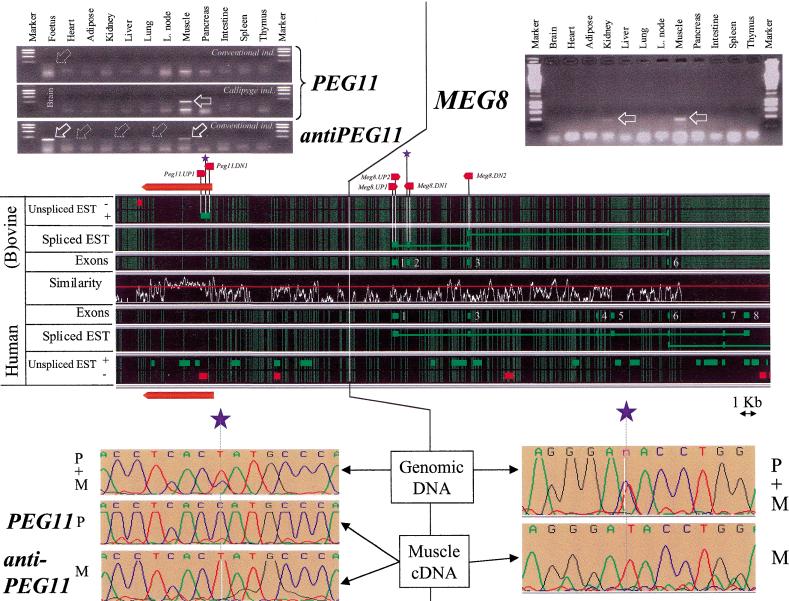
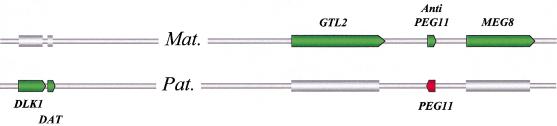
Two ovine BAC clones and a connecting long-range PCR product, jointly spanning approximately 250 kb and representing most of the MULGE5-OY3 marker interval known to contain the clpg locus, were completely sequenced. The resulting genomic sequence was aligned with its human ortholog and extensively annotated. Six transcripts, four of which were novel, were predicted to originate from within the analyzed region and their existence confirmed experimentally: DLK1, DAT, GTL2, PEG11, antiPEG11, and MEG8. RT-PCR experiments performed on a range of tissues sampled from an 8-wk-old animal demonstrated the preferential expression of all six transcripts in skeletal muscle, which suggests that they are under control of common regulatory elements. The six transcripts were also shown to be subject to parental imprinting: DLK1, DAT, and PEG11 were shown to be paternally expressed and GTL2, antiPEG11, and MEG8 to be maternally expressed.


Figures

Figure 1
Figure 1
Dot-matrix comparison of the human and ovine genomic sequences. The percent similarity represented by a given dot is indicated according to the color code shown. Positions and names of the identified genes are shown. Simple sequence repeats flanking the PEG11 gene are marked by arrows. (Inset) Alignment and ordering of 30 of the 55 ovine sequence contigs against the orthologous human genomic sequence by use of BLAST (Altschul et al. 1990). The ovine contigs are shown sorted according to their relative positions predicted on the basis of the observed human–ovine homology. Ovine contigs showing no hits with the human sequence in this figure were positioned on the basis of BLAST searches performed at lower stringency (data not shown).
Figure 2
Figure 2
Ovine–human comparative sequence annotation of the callipyge imprinted domain. (Gaps) White bars correspond to the gaps defined by the BESTFIT program (GCG Wisconsin Package) in, respectively, the ovine (O) and human (H) sequence when aligning the orthologous sequences between anchorpoints defined as in Results. These gaps are reported in the background in dark grey throughout the rest of the figure. The red bars in the “Gaps: O” line report the limits between adjacent ovine sequence contigs. (Repeats) Reports the positions of repetitive sequences identified with RepeatMasker (Smit & Green 2000) in, respectively, the ovine (O) and human (H) sequences, and labeled according to the color code shown at the bottom of the figure. (CpG islands/(G + C) content) The moving average (G + C) content computed using a 200-bp sliding window is shown for the human sequence (H) only, as the profiles were virtually identical in both species; the red line corresponds to 50% average (G + C) content. CpG islands defined according to Gardiner-Garden and Frommer (1987) and Larsen et al. (1992) are represented as yellow bars for the ovine (O) and human (H) sequences respectively. (Similarity) Similarity profile obtained by sliding a 100-bp window through the BESTFIT alignment and plotting the corresponding percent identity between the two species (H and O). The bottom line corresponds to 50% identity, and the red line to 80% identity. (ESTs) Genomic sequences aligned with at least one human (H) or bovine (O) EST when performing high-stringency BLAST searches with the corresponding repeat-masked genomic sequence against dbEST, are indicated by the thick yellow lines. The thin yellow lines connect noncontiguous genomic sequences which are either matching contiguous segments of the same EST (corresponding therefore to introns), or matching different ESTs belonging to the same cDNA clone. (GENSCAN “+”) (GENSCAN “−”) output of the GENSCAN software (Burge and Karlin 1997) applied to the “+” and “−” strand respectively. Predicted transcription start sites and polyadenylation signals are symbolized by white formula image and ▸, respectively. Exons are shown as green (“+” strand) or red (“−” strand) boxes, respectively. Conserved exons with a “forward–backward” probability value ≥ 0.9 in at least one of the two species are shown in bright colors; other exons in darker colors. The positions of three previously-described microsatellite markers (Berghmans et al. 2001): MULGE6, BULGE33, and BMS1561 are marked by blue asterisks on top of the sequence alignment. The position of the identified and confirmed genes or transcripts (DLK1, DAT, GTL2, PEG11, antiPEG11, and MEG8) are shown at the bottom of the sequence alignment.
Figure 3
Figure 3
Organization, expression profile, and imprinting of DLK1 and DAT. Spliced and unspliced ESTs whose transcriptional orientation could be inferred [(green) transcribed from the + strand; (red) transcribed from the − strand], were aligned with respect to the moving average similarity profile obtained for the human–ovine framework alignment (see Fig. 2). (Thick lines) EST matches; (thin lines) predicted introns. (Red arrows) The approximate positions of the primers used for genomic PCR, RT-PCR, and cycle sequencing; (blue asterisks) the approximate position of the SNPs used to evaluate the imprinting status. Expression profiles deduced from the analysis—by agarose gel electrophoresis—of RT-PCR products obtained with RNA from a range of tissues are shown, with specific amplification products marked by white arrows. Imprinting is demonstrated by comparison of the sequence traces obtained by cycle-sequencing equivalent amplification products obtained by genomic PCR versus RT-PCR. The parental origin of the alleles are labeled P (paternal) and M (maternal).
Figure 4
Figure 4
Organization, expression profile, and imprinting of GTL2. (For further details, see Fig. 3 legend.)
Figure 5
Figure 5
Organization, expression profile, and imprinting of PEG11, antiPEG11, and MEG8. For further details, see Fig. 3 legend. The large red arrow indicates the position of the PEG11 ORF predicted by GENSCAN.
Figure 6
Figure 6
Summary of the imprinting status in sheep of the genes/transcripts identified in the callipyge imprinted domain. Expressed, parent-of-origin specific alleles (Pat. or Mat.) are marked by green and red arrows when transcribed from the + or − strand, respectively.

References

    1. Altschul SF, Gish W, Miller W, Myers EW, Lipman DJ. Basic local alignment search tool. J Mol Biol. 1990;215:403–410. - PubMed
    1. Berghmans S, Segers K, Shay T, Georges M, Cockett N E, Charlier C. Breakpoint mapping positions the callipyge gene within a 285 kilobase chromosome segment containing the Gtl-2 gene. Mamm Genome. 2001;12:183–185. - PubMed
    1. Bernardi G. The human genome: Organization and evolutionary history. Annu Rev Genet. 1995;29:445–476. - PubMed
    1. Burge C, Karlin S. Prediction of complete gene structures in human genomic DNA. J Mol Biol. 1997;268:78–94. - PubMed
    1. Cockett NE, Jackson SP, Shay TL, Nielsen D, Green RD, Georges M. Chromosomal localisation of the callipyge gene in sheep (Ovis aries) using bovine DNA markers. Proc Natl Acad Sci. 1994;91:3019–3023. - PMC - PubMed

Publication types

MeSH terms

Associated data

LinkOut - more resources