Comparative Study
. 2001 May;11(5):875-88.
doi: 10.1101/gr.177901.

Basecalling with LifeTrace

Affiliations
Comparative Study

Basecalling with LifeTrace

D Walther et al. Genome Res. 2001 May.

Abstract

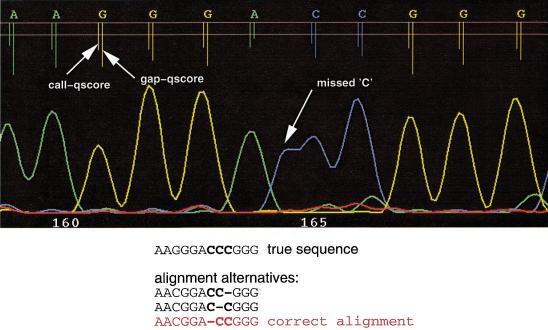
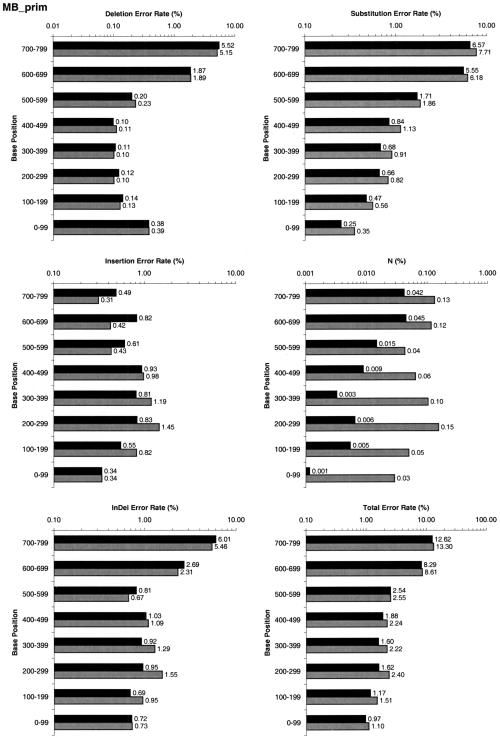
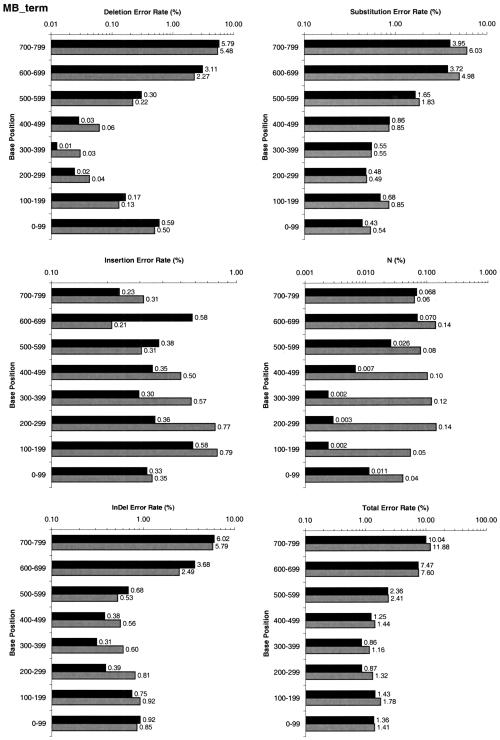
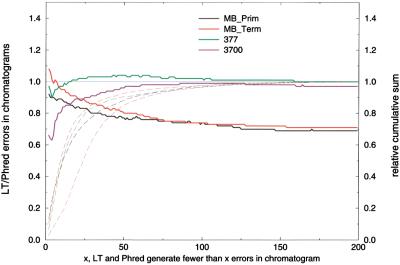
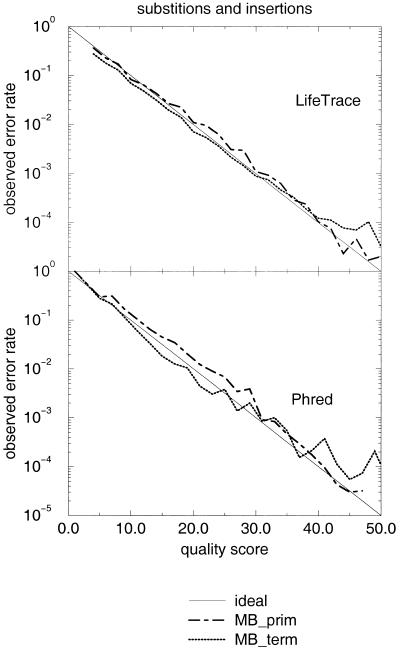
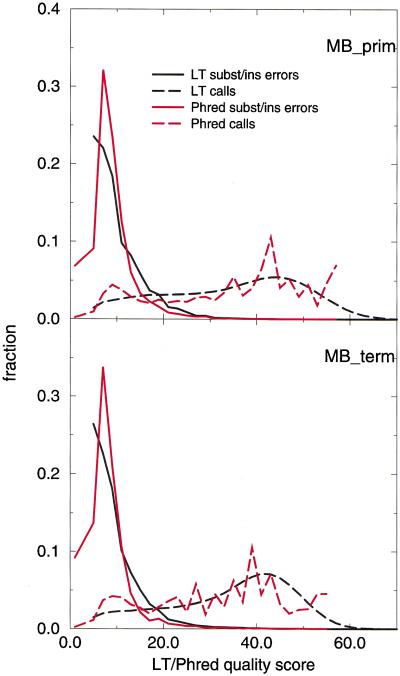
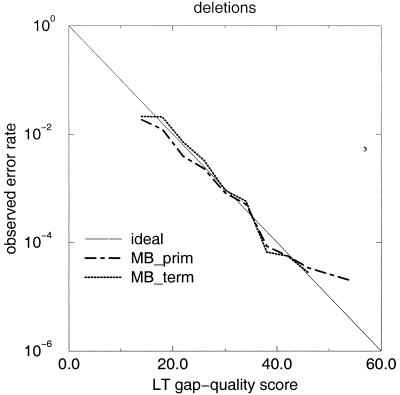
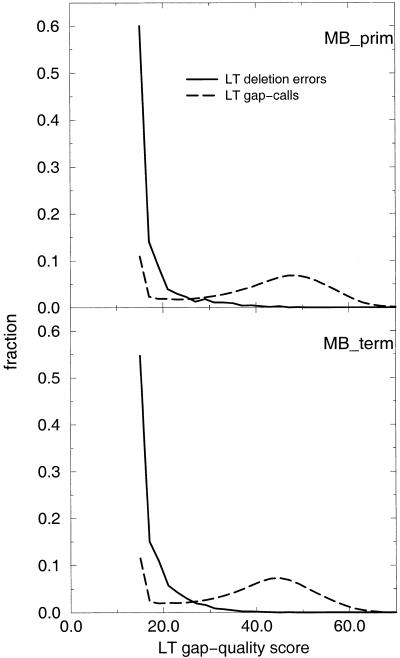
A pivotal step in electrophoresis sequencing is the conversion of the raw, continuous chromatogram data into the actual sequence of discrete nucleotides, a process referred to as basecalling. We describe a novel algorithm for basecalling implemented in the program LifeTrace. Like Phred, currently the most widely used basecalling software program, LifeTrace takes processed trace data as input. It was designed to be tolerant to variable peak spacing by means of an improved peak-detection algorithm that emphasizes local chromatogram information over global properties. LifeTrace is shown to generate high-quality basecalls and reliable quality scores. It proved particularly effective when applied to MegaBACE capillary sequencing machines. In a benchmark test of 8372 dye-primer MegaBACE chromatograms, LifeTrace generated 17% fewer substitution errors, 16% fewer insertion/deletion errors, and 2.4% more aligned bases to the finished sequence than did Phred. For two sets totaling 6624 dye-terminator chromatograms, the performance improvement was 15% fewer substitution errors, 10% fewer insertion/deletion errors, and 2.1% more aligned bases. The processing time required by LifeTrace is comparable to that of Phred. The predicted quality scores were in line with observed quality scores, permitting direct use for quality clipping and in silico single nucleotide polymorphism (SNP) detection. Furthermore, we introduce a new type of quality score associated with every basecall: the gap-quality. It estimates the probability of a deletion error between the current and the following basecall. This additional quality score improves detection of single basepair deletions when used for locating potential basecalling errors during the alignment. We also describe a new protocol for benchmarking that we believe better discerns basecaller performance differences than methods previously published.


Figures

Figure 1
Figure 1
(A) Sample MegaBACE chromatogram with corresponding basecalls by Phred (top) and LifeTrace (bottom). Length of peak locator tick lines corresponds to associated quality scores, with longer ticks indicating higher quality. Horizontal lines mark quality score levels of 0 and 15, respectively. (B) Peak–peak distance as a function of peak location as determined by LifeTrace. For every peak at a given chromatogram location (x-axis), its associated distance to the next peak is plotted (y-axis). The chromatogram segment shown in A corresponds to chromatogram location between 4000 and 4400.
Figure 2
Figure 2
Illustration of the processing of chromatogram trace data by LifeTrace. Shown are the four original traces and the composite trace LT (Eq.4) that provides the basis for peak detection. LifeTrace basecalls are given in the top row with the length of the tick lines that indicate the peak location corresponding to the LifeTrace quality score, with longer ticks indicating higher quality. The two horizontal lines mark quality score 0 and 15. Locations illustrate the facilitated peak detection provided by trace transformations of LifeTrace (transformed trace LT) making it possible to (a) reliably detect peaks that are peak shoulders and not local maxima, yet are real; (b) separate overlapping peaks; and (c) to reduce noise from residual traces as they are not reflected in local maxima in the trace LT.
Figure 3
Figure 3
Illustration of the concept of a gap-quality introduced in LifeTrace. Part of a sample chromatogram shows traces and calls, with associated quality scores quantified by the length of the peak locator tick mark. Two horizontal lines mark quality score levels of 0 and 15. The left tick line represents the quality score of the actual base call, whereas the right tick line measures the quality of the gap to the following called base. In this example, a basecall error has occurred: a C was not called. This single C-deletion can generate three different alignments of equal alignment score as shown below. However, the chromatogram suggests that the error has occurred in the first position of the three C run. This is reflected in the low gap-quality score of the preceding A. By taking into account gap-quality scores during alignments, the gap is correctly positioned at the first position.
Figure 4
Figure 4
Performance comparison of Phred (gray bars) and LifeTrace (black bars) using Method 1 (see Performance Analysis). Basecall errors are analyzed for the different error types and as a function of position in the called sequence. (A) MegaBACE dye-primer set, (B) MegaBACE dye-terminator set. InDel indicates combined insertions and deletion errors; N, called Ns (i.e., undecided basecalls).
Figure 4
Figure 4
Performance comparison of Phred (gray bars) and LifeTrace (black bars) using Method 1 (see Performance Analysis). Basecall errors are analyzed for the different error types and as a function of position in the called sequence. (A) MegaBACE dye-primer set, (B) MegaBACE dye-terminator set. InDel indicates combined insertions and deletion errors; N, called Ns (i.e., undecided basecalls).
Figure 5
Figure 5
Comparison of LifeTrace error rate to Phred error rate in subsets of chromatograms grouped according to quality of the chromatogram. Quality is expressed as the maximum allowed number of basecall errors made by either LifeTrace or Phred, that is, max(LifeTrace_errors, Phred_errors). For example, chromatograms for which both LifeTrace and Phred generate fewer than five basecall errors can be considered high-quality chromatograms. As the graph shows, LifeTrace outperforms Phred in a set of chromatograms for which Phred generates many errors but LifeTrace makes few. Error rates are normalized by the number of Phred errors (i.e., Phred is the horizontal line at relative error rate 1). Broken lines correspond to the cumulative sum of the number of chromatograms normalized by the total number of chromatograms in the set at a given error threshold with the color code matching the legend colors.
Figure 6
Figure 6
Fidelity of LifeTrace and Phred quality scores. Quality scores associated with all basecalls aligned to the true sequence were binned into intervals of width Δ(q-score) = 2. Semi-logarithmic plot shows observed error rate in each bin as a function of quality score associated with that bin for the dye-primer and dye-terminator MegaBACE chromatogram set analyzed. Only substitution and insertion errors are considered here as deletion errors are captured by the newly introduced gap-quality score (see Fig. 3), and a deleted base itself does not have a quality as it does not exist. Ideal refers to the ideal line of.
Figure 7
Figure 7
Discriminative power of quality scores and retention of high-quality base calls. Frequency distribution of quality scores associated with substitution and insertion errors and all basecalls for basecallers LifeTrace and Phred for the chromatogram sets examined. Frequencies are computed for calls binned into width intervals of two units of quality scores.
Figure 8
Figure 8
Fidelity of LifeTrace gap-quality scores. Semi-logarithmic plot of observed frequency of deletion errors as a function of assigned gap-quality score of the preceding base in the alignment for the MegaBACE chromatogram sets (primer and terminator) analyzed. The gap-quality score of the base preceding the gap captures the quality of the gap to the next called base, that is, low gap-qualities indicate a high probability that another base might be between this and the next called base indicating a high likelihood of a deletion error. In LifeTrace, gaps are considered a call. Observed error rate indicates the fraction of incorrect gaps (missed true basecall in between) out of all called gaps; ideal line, the same as in Figure 8. Bin width was 4 quality units.
Figure 9
Figure 9
Discriminative power of LifeTrace gap-quality scores. Frequency distribution of quality scores associated with deletion errors (gap-quality assigned to the gap-preceding basecall) and all gap calls for basecaller LifeTrace for the chromatogram sets examined. Frequencies are computed for calls binned into width intervals of 2 units of quality scores.

References

    1. Altschul SF, Gish W, Miller W, Myers E, Lipman DJ. Basic local alignment search tool. J Mol Biol. 1990;215:403–410. - PubMed
    1. Altshuler D, Pollara VJ, Cowles CR, Van Etten WJ, Baldwin J, Linton L, Lander ES. An SNP map of the human genome generated by reduced representation shotgun sequencing. Nature. 2000;407:513–516. - PubMed
    1. Berno AJ. A graph theoretic approach to the analysis of DNA sequencing data. Genome Res. 1996;6:90–91. - PubMed
    1. Buetow KH, Edmonson MN, Cassidy AB. Reliable identification of large numbers of candidate SNPs from public EST data. Nat Genet. 1999;21:323–325. - PubMed
    1. Ewing B, Green P. Base-calling of automated sequencer traces using Phred II: Error probabilities. Genome Res. 1998;8:186–194. - PubMed

Publication types

LinkOut - more resources