Comparative Study
. 2001 May;11(5):889-900.
doi: 10.1101/gr.155001.

Gene structure prediction and alternative splicing analysis using genomically aligned ESTs

Affiliations
Comparative Study

Gene structure prediction and alternative splicing analysis using genomically aligned ESTs

Z Kan et al. Genome Res. 2001 May.

Abstract

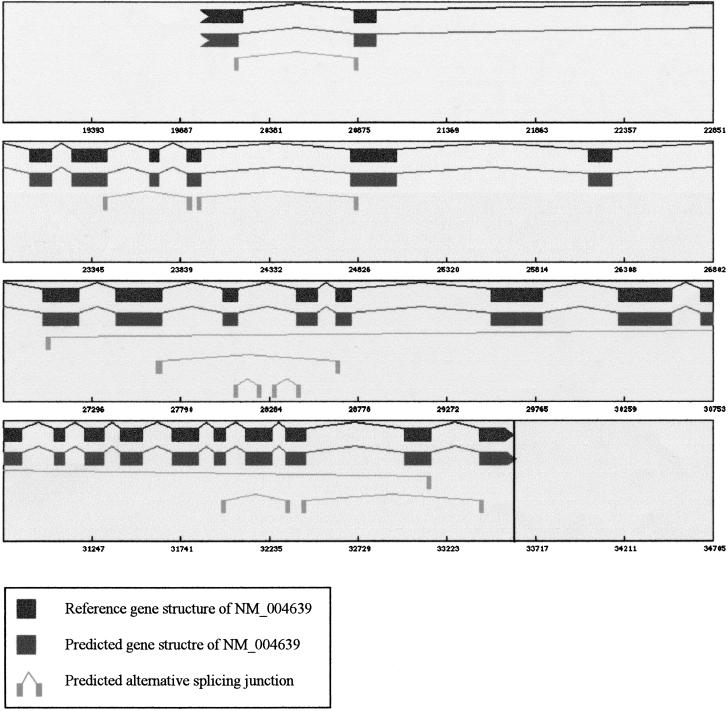
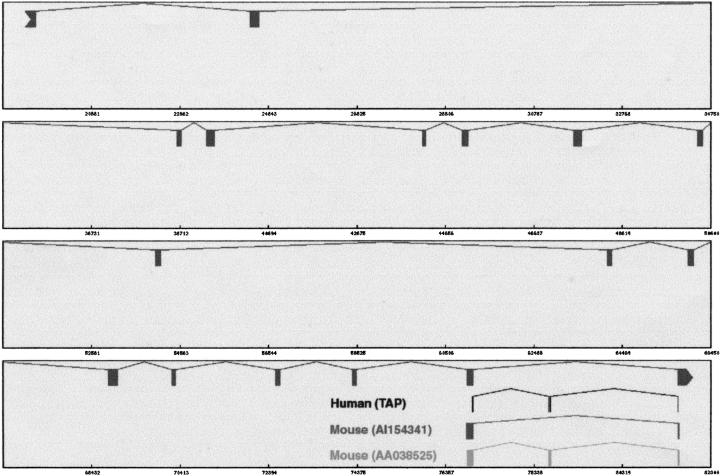
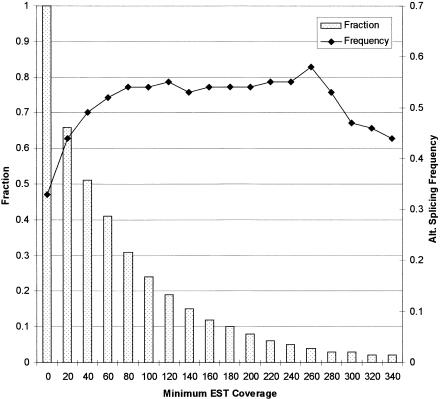
With the availability of a nearly complete sequence of the human genome, aligning expressed sequence tags (EST) to the genomic sequence has become a practical and powerful strategy for gene prediction. Elucidating gene structure is a complex problem requiring the identification of splice junctions, gene boundaries, and alternative splicing variants. We have developed a software tool, Transcript Assembly Program (TAP), to delineate gene structures using genomically aligned EST sequences. TAP assembles the joint gene structure of the entire genomic region from individual splice junction pairs, using a novel algorithm that uses the EST-encoded connectivity and redundancy information to sort out the complex alternative splicing patterns. A method called polyadenylation site scan (PASS) has been developed to detect poly-A sites in the genome. TAP uses these predictions to identify gene boundaries by segmenting the joint gene structure at polyadenylated terminal exons. Reconstructing 1007 known transcripts, TAP scored a sensitivity (Sn) of 60% and a specificity (Sp) of 92% at the exon level. The gene boundary identification process was found to be accurate 78% of the time. also reports alternative splicing patterns in EST alignments. An analysis of alternative splicing in 1124 genic regions suggested that more than half of human genes undergo alternative splicing. Surprisingly, we saw an absolute majority of the detected alternative splicing events affect the coding region. Furthermore, the evolutionary conservation of alternative splicing between human and mouse was analyzed using an EST-based approach. (See http://stl.wustl.edu/~zkan/TAP/)


Figures

Figure 1
Figure 1
Gene boundary identification. TAP uses a computer-generated graphic plot to illustrate the predicted gene structures. Shown here is the prediction on the genomic template of FANCG gene (NM_004629, Fanconi anemia, complementation group G). The blocks in the top level of each window represent exons in the reference gene structure. The blocks in the second level represent the predicted exons. Predicted poly-A sites are labeled by vertical lines. The region between two exons is either a splice junction pair (line) or a gap. Genes are colored differently according to inferred gene boundaries. In this plot, a boundary happens to be defined in each gap that follows a polyadenylated exon.
Figure 2
Figure 2
Prediction of alternative splicing patterns. This plot shows both the predicted gene structure and alternative splicing patterns for D6S52E gene (NM_004639, HLA-B associated transcript-3). The reference gene structure is displayed in the first level. The predicted gene structure is shown in the second level. TAP detected nine alternative splice pairs by comparing with the reference gene structure. Sorted by the start coordinates, these are 20211–20855 (AW408054.1), 23432–23880 (AL046298.1), 23954–24805 (AL046298.1), 27064–33110 (AW182608.1), 27684–28653 (AL041773.1), 28105–28216 (AW380963.1), 28323–28436 (AW380963.1), 31988–32327 (AI024684), and 32434–33407 (AI024684). For each splice pair, one of the EST carriers is denoted in parentheses.
Figure 3
Figure 3
An example of conserved alternative splicing pattern. Shown here is a conserved exon skipping event at the 3′ end of RPN2 gene (NM_002951). The reference gene structure is displayed in the top level. The alternative splice pairs predicted from human ESTs, 76969–78662 and 78709–81563, are shown in the second level. We found that both the reference and alternative patterns were conserved. The mouse ESTs were aligned to the human genomic template using sim4. Each aligned block has ± 88% identity. The graphic plot was modified to illustrate these alignments. In the third level, the alignment of EST AI154341 shows the same pattern as the reference gene structure. In the bottom level, the alignment of EST AA038525 displays the alternative splicing pattern.
Figure 4
Figure 4
Correlation of alternative splicing frequency with EST coverage. The frequency of alternative splicing was measured by the proportion of sequences that were alternatively spliced. A threshold on minimum EST coverage was imposed to select a subset of sequences. As the threshold was raised from zero to 340, the fraction of sequences (bar, left axis) that met the requirement was decreasing. The alternative splicing frequency (line, right axis) increased from 33% to 55% at lower EST coverage, and stabilized at roughly 55% at higher EST coverage.
Figure 5
Figure 5
Gene prediction on both strands. This is a graphic illustration of gene predictions in the genomic template of NM_005155, palmitoyl-protein thioesterase 2 (PPT2). Reference gene structure is shown in the first level of each window. Gene predictions on the plus strand are plotted in the second level and gene predictions on the minus strand are plotted in the bottom level. The transcriptional direction of a gene is also indicated by the arrow shape of its terminal exon. Only poly-A sites on the plus strand are shown in vertical lines. The middle levels are used to display alternative splicing patterns that are inferred by comparing predicted splice junction pairs with the reference gene structure. Note that the predicted gene structure of NM_005155 consists of extensions to the reference gene structure at both ends. The second predicted gene on the plus strand overlaps with the 3′ UTR of a gene on the opposite strand, but its 3′ boundary is not extended.
Figure 6
Figure 6
Gene structure assembly. (A) Shown here is a hypothetical gene structure (block) and genomic EST alignments (line). There are five inferred splice pairs. Splice pairs 1 and 2 are transitively connected. Splice pairs 2 and 4 are contiguously connected. Both splice pairs 2 and 4 are mutually exclusive with splice pair 3. There is a coverage gap between splice pair 5 and the 3′ end. (B) The connectivity matrix for assembling this gene structure. The nodes include the 5′ beginning (BEG) of the EST alignments, the 3′ end (END) and five predicted splice pairs. The numerical value in cell M(i,j) is determined from the EST-encoded connectivity between the ith and jth nodes. For instance, two EST alignments link splice pairs 2 and 4, so M(2,4) = 2. (C) Two alternative gene structures inferred from two different traces through the matrix. The higher scoring trace gives rise to the predominant gene structure.

References

    1. Bafna V, Huson DH. The conserved exon method for gene finding. Intell Syst Mol Biol. 2000;8:3–12. - PubMed
    1. Batzoglou S, Pachter L, Mesirov JP, Berger B, Lander E. Human and mouse gene structure: Comparative analysis and application to exon prediction. Genome Res. 2000;10:950–958. - PMC - PubMed
    1. Bedell JA, Korf I, Gish W. MaskerAid: A performance enhancement to RepeatMasker. Bioinformatics. 2000;16:1040–1041. - PubMed
    1. Bouck J, Yu W, Gibbs R, Worley K. Comparison of gene indexing databases. Trends Genet. 1999;15:159–161. - PubMed
    1. Brett D, Hanke J, Lehmann G, Hasse S, Delbruck S, Krueger S, Reich J, Bork P. EST comparison indicates 38% of human mRNAs contain possible alternative splice forms. FEBS Lett. 2000;47:83–86. - PubMed

Publication types