. 2001 Apr;29(4):298-310.
doi: 10.1114/1.1359450.

Modeling advection and diffusion of oxygen in complex vascular networks

Affiliations

Modeling advection and diffusion of oxygen in complex vascular networks

D A Beard et al. Ann Biomed Eng. 2001 Apr.

Abstract

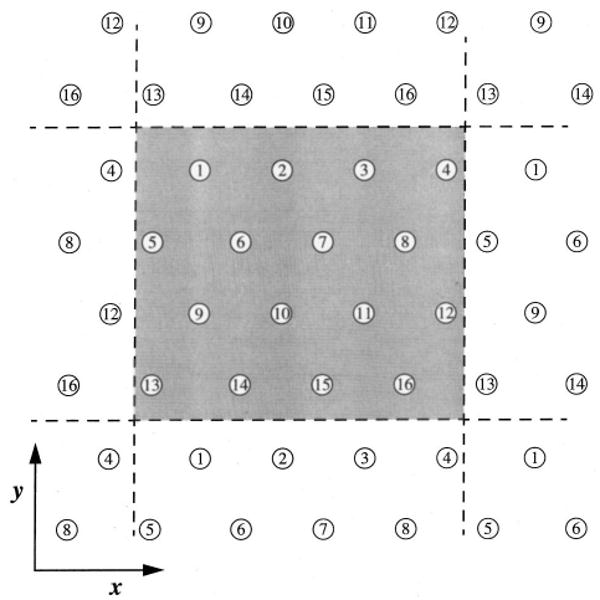
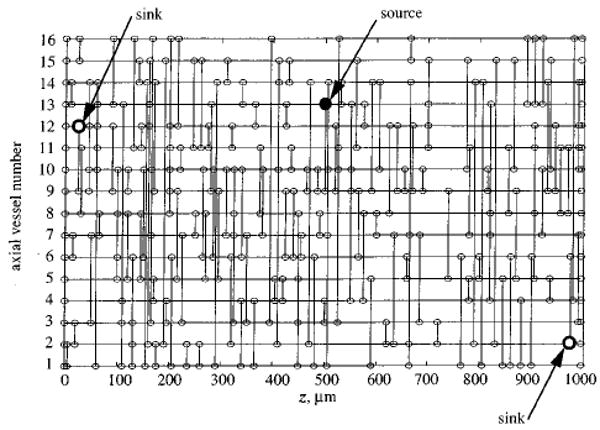
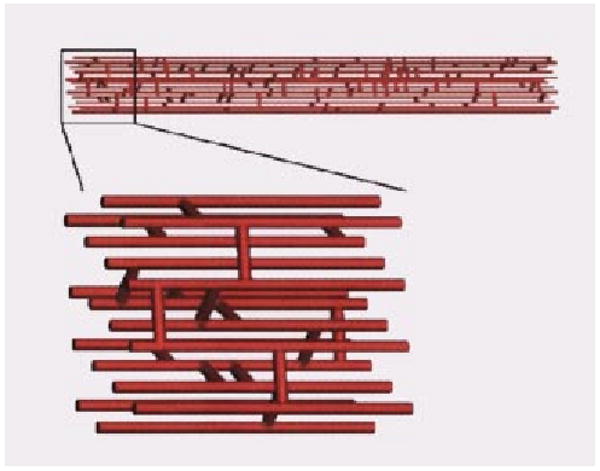
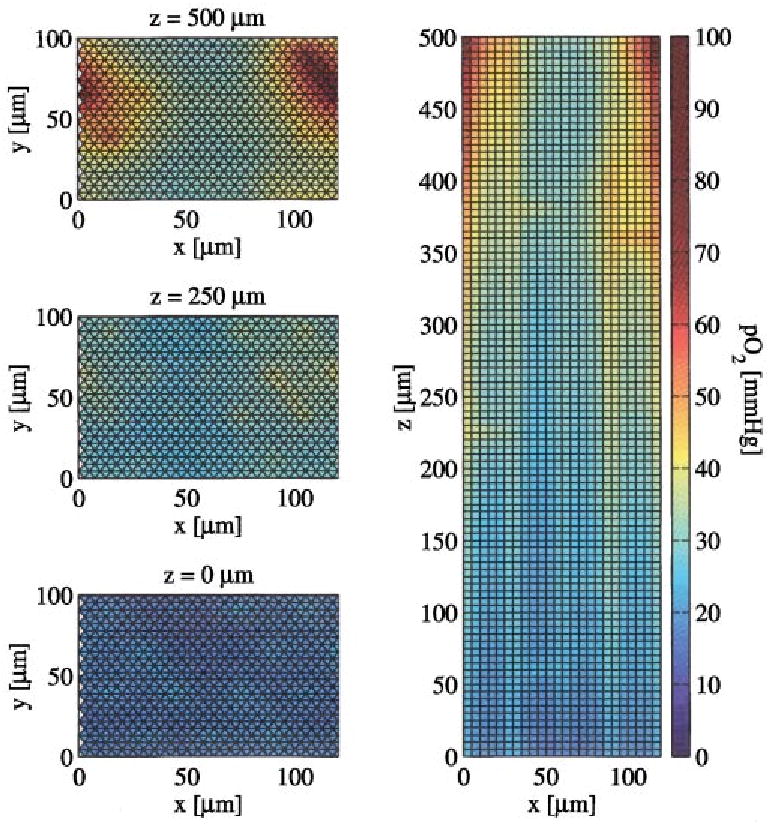
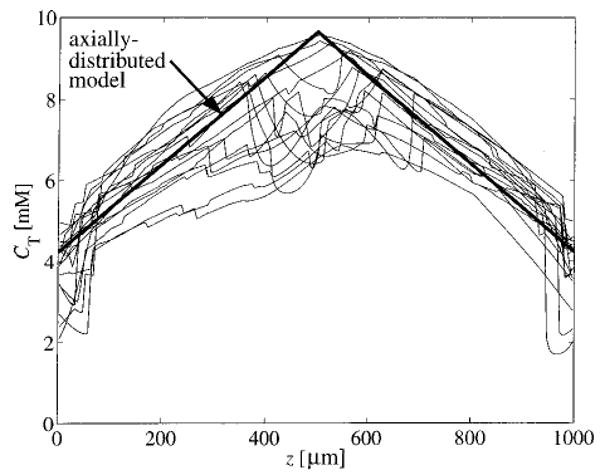
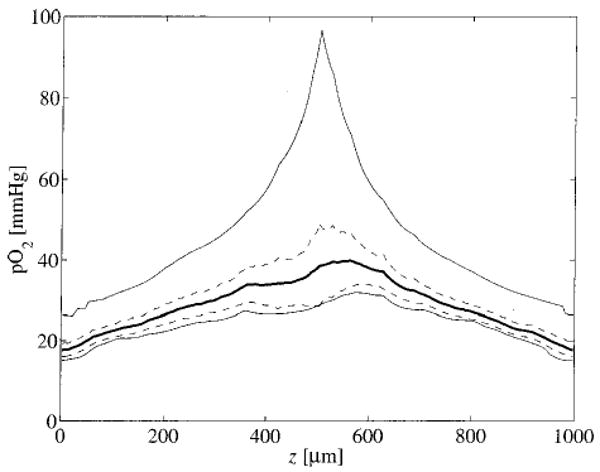
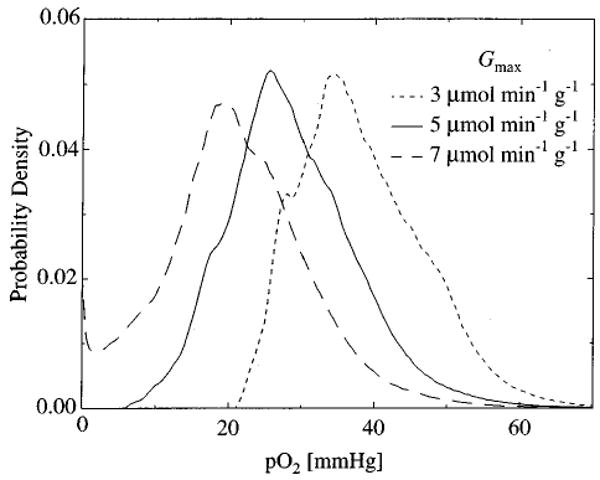
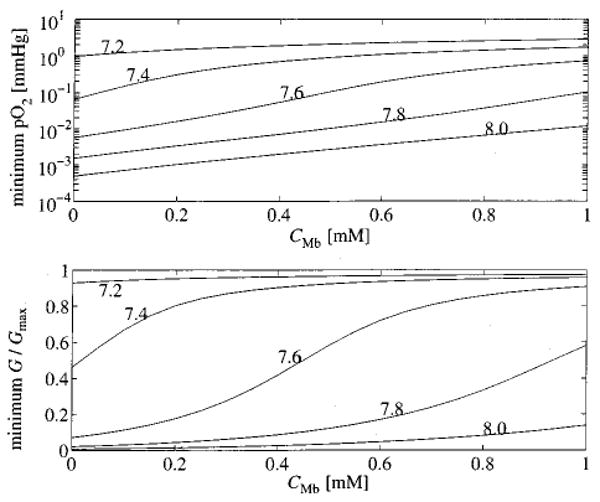
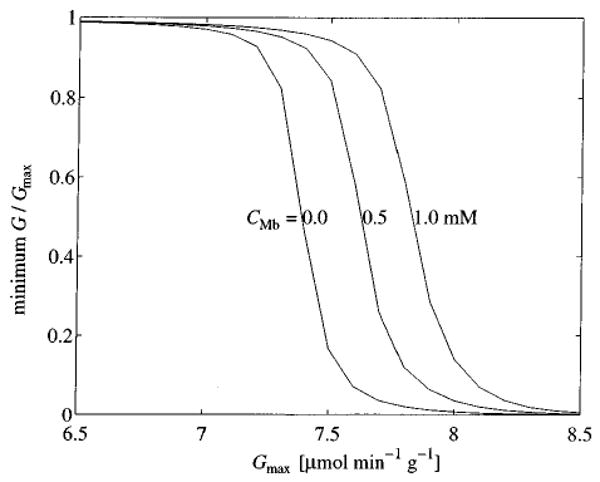
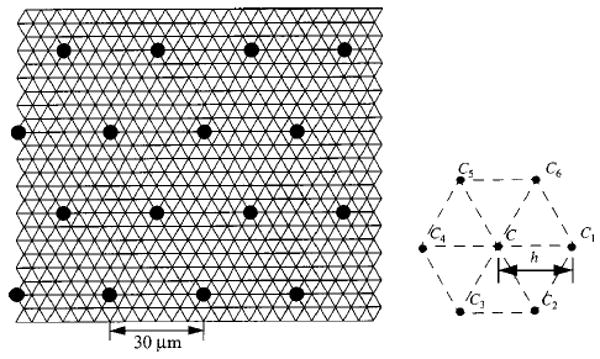
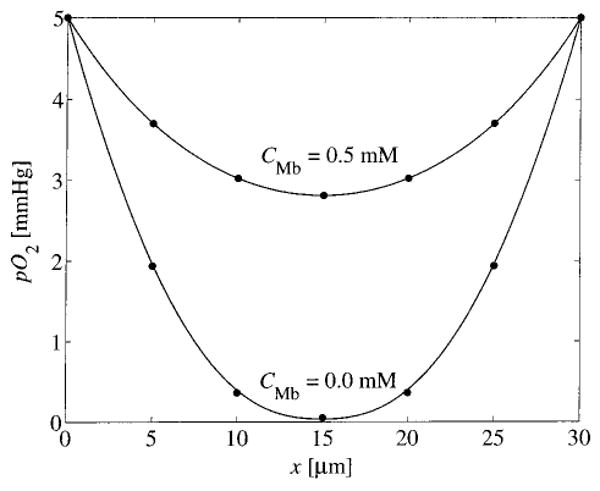
A realistic geometric model for the three-dimensional capillary network geometry is used as a framework for studying the transport and consumption of oxygen in cardiac tissue. The nontree-like capillary network conforms to the available morphometric statistics and is supplied by a single arterial source and drains into a pair of venular sinks. We explore steady-state oxygen transport and consumption in the tissue using a mathematical model which accounts for advection in the vascular network, nonlinear binding of dissolved oxygen to hemoglobin and myoglobin, passive diffusion of freely dissolved and protein-bound oxygen, and Michaelis-Menten consumption in the parenchymal tissue. The advection velocity field is found by solving the hemodynamic problem for flow throughout the network. The resulting system is described by a set of coupled nonlinear elliptic equations, which are solved using a finite-difference numerical approximation. We find that coupled advection and diffusion in the three-dimensional system enhance the dispersion of oxygen in the tissue compared to the predictions of simplified axially distributed models, and that no "lethal corner," or oxygen-deprived region occurs for physiologically reasonable values for flow and consumption. Concentrations of 0.5-1.0 mM myoglobin facilitate the transport of oxygen and thereby protect the tissue from hypoxia at levels near its P50, that is, when local oxygen consumption rates are close to those of delivery by flow and myoglobin-facilitated diffusion, a fairly narrow range.


Figures

FIGURE 1
FIGURE 1
Hexagonal distribution of axially aligned segments. The network is modeled as a periodic arrangement of 16 axial segment positions in the xy plane. The intercapillary distance used for the calculation was 30 μm.
FIGURE 2
FIGURE 2
Topology of a network generated by randomly placing 160 crossconnecting segments between nearest neighbor axial vessels. The axial vessel number (see Fig. 1) is plotted vs the axial position. Nodes are indicated as small circles; large filled circle indicates arteriolar source; large open circles indicate venular sinks.
FIGURE 3
FIGURE 3
Three-dimensional rendering of capillary network. Sixteen axially aligned vessels are connected by 160 randomly placed cross connecting segments. A detail of the network is shown in the lower panel.
FIGURE 4
FIGURE 4
Images of oxygen tension in various slices through the tissue. On the left are slices in the xy plane at z=0, 250, and 500 μm. The image on the right is a slice in the xy plane. For these results, CMb=0.5×10⁻³ M and Gmax =5 μmol min−1g−1. Note that pO2 gradients are evident within capillaries and that there is no sudden drop in pO2 at the capillary wall since the wall is so permeable to O2.
FIGURE 5
FIGURE 5
Total intravascular oxygen concentration in each axial vessel is plotted vs axial position. Also plotted is the concentration predicted by an axially distributed model and a compartmental model. Here, CMb=0.5×10⁻³ M and Gmax = 5 μmol min−1 g−1.
FIGURE 6
FIGURE 6
Tissue pO2 in the xy plane is plotted as a function of axial position. The dark solid line represents the mean pO2 in the xy plane at each axial position. The dashed lines represent the mean plus and minus one standard deviation. The thin lines are the maximum and minimum values of pO2. For these results, CMb=0.5–10−3 M and Gmax=5 μmol min−1 g−1.
FIGURE 7
FIGURE 7
The probability density of tissue pO2 predicted by the model is plotted for various values of Gmax. As Gmax increases, tissue pO2 decreases. When Gmax =7 μmol min−1g−1, a fraction of the tissue is hypoxic. These results are for oxygen concentration in ten independent realizations of the microvessel network computed using CMb = 0.5×10⁻³ M.
FIGURE 8
FIGURE 8
The effectiveness of myoglobin facilitated transport at preventing hypoxia is investigated for various concentration of myoglobin. In the upper panel, the minimum pO2 in the tissue is plotted as a function of the concentration of myoglobin in the tissue. Each curve is labeled with the value of Gmax in μmol min−1 g−1 used in the computation. The lower panel plots the minimum oxygen consumption normalized to Gmax as a function of CMb.
FIGURE 9
FIGURE 9
Minimum oxygen consumption as a function of Gmax for various levels of CMb.
FIGURE 10
FIGURE 10
Hexagonal grid used for numerical computation. Concentration at a node is denoted by C. Concentrations in the six surrounding nodes in the xy plane are denoted by C1C6.
FIGURE 11
FIGURE 11
Numerical solutions to Eq. (23). Predicted pO2 is plotted vs x, for h=0.5 μm (solid lines) and h=5.0 μm (circles) for CMb of 0.05 and 0.0 mM. Gmax=2×10⁻⁴ Ms−1.

References

    1. Bassingthwaighte JB, Yipintsoi T, Harvey RB. Microvasculature of the dog left ventricular myocardium. Microvasc Res. 1974;7:229–249. - PMC - PubMed
    1. Batra S, Rakusan K. Morphometric analysis of capillary nets in rat myocardium. Adv Exp Med Biol. 1990;277:377–385. - PubMed
    1. Beard DA, Bassingthwaighte JB. Advection and diffusion of substances in biological tissues with complex vascular networks. Ann Biomed Eng. 2000;28:253–268. - PMC - PubMed
    1. Beard DA. Computational framework for generating transport models from databases of microvascular anatomy. Ann Biomed Eng. 2001;29(10):837–843. - PubMed
    1. Bentley TB, Meng H, Pittman RN. Temperature dependence of oxygen diffusion and consumption in mammalian striated muscle. Am J Physiol. 1993;264:H1825–H1830. - PubMed

Publication types