. 2001 May;13(5):1193-204.
doi: 10.1105/tpc.13.5.1193.

Antisense inhibition of the photosynthetic antenna proteins CP29 and CP26: implications for the mechanism of protective energy dissipation

Affiliations

Antisense inhibition of the photosynthetic antenna proteins CP29 and CP26: implications for the mechanism of protective energy dissipation

J Andersson et al. Plant Cell. 2001 May.

Abstract

The specific roles of the chlorophyll a/b binding proteins CP29 and CP26 in light harvesting and energy dissipation within the photosynthetic apparatus have been investigated. Arabidopsis was transformed with antisense constructs against the genes encoding the CP29 or CP26 apoprotein, which gave rise to several transgenic lines with remarkably low amounts of the antisense target proteins. The decrease in the level of CP24 protein in the CP29 antisense lines indicates a physical interaction between these complexes. Analysis of chlorophyll fluorescence showed that removal of the proteins affected photosystem II function, probably as a result of changes in the organization of the light-harvesting antenna. However, whole plant measurements showed that overall photosynthetic rates were similar to those in the wild type. Both antisense lines were capable of the qE type of nonphotochemical fluorescence quenching, although there were minor changes in the capacity for quenching and in its induction kinetics. High-light-induced violaxanthin deepoxidation to zeaxanthin was not affected, although the pool size of these pigments was decreased slightly. We conclude that CP29 and CP26 are unlikely to be sites for nonphotochemical quenching.


Figures

Figure 1.
Figure 1.
Homology between CP29 Isoforms. Alignment of the predicted amino acid sequences of the products of the three Lhcb4 genes of Arabidopsis showing their strong sequence similarity. Shading denotes residues conserved between at least two of the sequences. The arrowhead indicates the putative transit peptide cleavage site.
Figure 2.
Figure 2.
Immunoblot Analysis of Primary Transformants. Thylakoid protein samples from primary transformants (T1 generation) of CP29 (A) and CP26 (B) were screened using antibodies against CP29 and CP26, respectively. The outer lanes contain samples from wild-type plants, flanking samples from eight arbitrarily selected primary transformants of each antisense construct.
Figure 3.
Figure 3.
Growth and Morphology of CP29 and CP26 Antisense Plants. Antisense plants were grown in low light under standard conditions as described in the text. Growth rate, morphology, and pigmentation were indistinguishable between the antisense plants and the wild-type parental line.
Figure 4.
Figure 4.
Immunoblot and RNA Gel Blot Analysis of CP29 and CP26 Antisense Lines. (A) Thylakoid samples were probed with antibodies specific for the indicated proteins. (B) RNA samples were hybridized with radiolabeled, gene-specific polymerase chain reaction fragments homologous with the genes encoding PSII antenna proteins, as indicated. wt, wild type.
Figure 5.
Figure 5.
Photosynthetic Oxygen Evolution in Saturating CO2. The rate of oxygen evolution from leaf discs was measured during illumination with varying levels of broadband red light for plants (wild type, white symbols; CP29 antisense, gray symbols; CP26 antisense, black symbols) grown under HL (triangles) or LL (circles). Symbols and error bars show means ±se (n ≥ 4). PFD, photon flux density.
Figure 6.
Figure 6.
Room Temperature Chlorophyll Fluorescence from Thylakoids. (A) Fluorescence traces from broken chloroplasts from LL-grown wild-type (wt), CP29 antisense, and CP26 antisense plants showing the dark (Fo) fluorescence level achieved after application of the low- intensity measuring beam and the maximum (Fm) level achieved after application of an intense light pulse. (B) Fv/Fm measurements from broken chloroplasts from LL-grown plants (wild type, white symbols; CP29 antisense, gray symbols; CP26 antisense, black symbols) after storage on ice. Squares and error bars denote the Fv/Fm of intact leaves (mean ±se, see Table 2). Data are from four or five separate chloroplast preparations for each set of plants.
Figure 7.
Figure 7.
Whole-Leaf Fluorescence Emission Spectra at 77K. Fluorescence emission spectra were determined for intact leaves from CP29 antisense plants, CP26 antisense plants, and untransformed control plants (wild type [wt]) at 77K. The spectra are normalized to the 732-nm emission peak emanating from PSI. Each curve is the mean of separate measurements on nine to 20 different leaves.
Figure 8.
Figure 8.
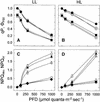
Analysis of Room Temperature Chlorophyll Fluorescence during Photosynthesis. Fluorescence was monitored in leaf discs from dark-adapted plants (wild type, white symbols; CP29 antisense, gray symbols; CP26 antisense, black symbols) grown in low light ([A] and [C]) or high light ([B] and [D]). Leaf discs were given 23 min of illumination in the presence of saturating CO2 followed by 10 min in the dark. (A) and (B) PSII redox state (qP; circles) and photosynthetic efficiency (ΦPSII; squares) during steady state photosynthesis. (C) and (D) Reversible energy dissipation (NPQrev; triangles) and irreversible energy dissipation (NPQirr; diamonds). Symbols and error bars show means ±se (n ≥ 3). PFD, photon flux density.
Figure 9.
Figure 9.
Kinetics of the Formation and Relaxation of Photoprotective Energy Dissipation. Fluorescence was monitored in leaf discs from LL-grown plants (wild type, white circles; CP29 antisense, gray circles; CP26 antisense, black circles) during two successive periods of illumination with strong light (1000 μmol quanta·m−2·sec−1), as indicated by the gray bars, with a 17-min period of darkness in between. Symbols and error bars show means ±se (n ≥ 3) for the total energy dissipation NPQ.

References

    1. Bassi, R., and Dainese, P. (1992). A supramolecular light-harvesting complex from chloroplast photosystem-II membranes. Eur. J. Biochem. 204 317–326. - PubMed
    1. Bassi, R., Giuffra, E., Croce, R., Dainese, P., and Bergantino, E. (1996). Biochemistry and molecular biology of pigment binding proteins. In Light as an Energy Source and Information Carrier in Plant Physiology, R.C. Jennings, G. Zucchelli, F. Ghetti, and G. Colombetti, eds (New York: Plenum Press), pp. 41–63.
    1. Bassi, R., Sandona, D., and Croce, R. (1997). Novel aspects of chlorophyll a/b-binding proteins. Physiol. Plant. 100 769–779.
    1. Boekema, E.J., van Roon, H., and Dekker, J.P. (1998). Specific association of photosystem II and light-harvesting complex II in partially solubilized photosystem II membranes. FEBS Lett. 424 95–99. - PubMed
    1. Britton, G. (1995). UV/visible spectroscopy. In Carotenoids, Vol. 1B, Spectroscopy, G. Britton, S. Liaaen-Jensen, and H. Pfander, eds (Basel, Switzerland: Birkhauser Verlag), pp. 458–488.

Publication types

MeSH terms

LinkOut - more resources