. 2001 May 22;98(11):6453-8.
doi: 10.1073/pnas.101120998. Epub 2001 May 8.

Requirement of the nicotinic acetylcholine receptor beta 2 subunit for the anatomical and functional development of the visual system

Affiliations

Requirement of the nicotinic acetylcholine receptor beta 2 subunit for the anatomical and functional development of the visual system

F M Rossi et al. Proc Natl Acad Sci U S A. .

Abstract

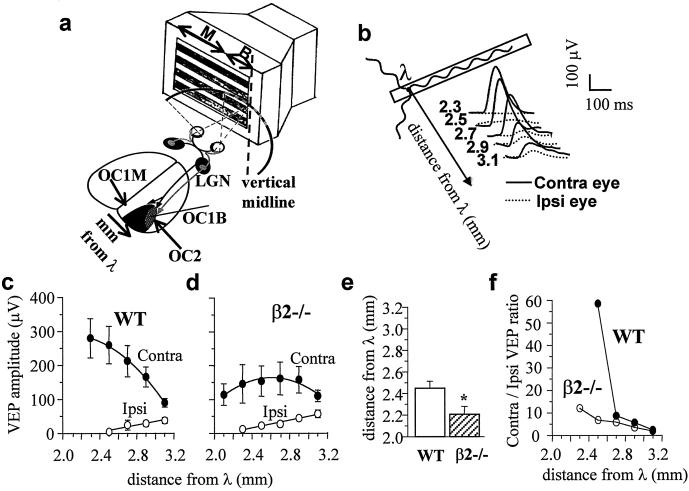
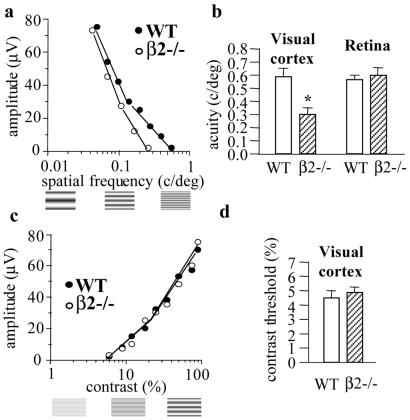
In the mammalian visual system the formation of eye-specific layers at the thalamic level depends on retinal waves of spontaneous activity, which rely on nicotinic acetylcholine receptor activation. We found that in mutant mice lacking the beta2 subunit of the neuronal nicotinic receptor, but not in mice lacking the alpha4 subunit, retinofugal projections do not segregate into eye-specific areas, both in the dorso-lateral geniculate nucleus and in the superior colliculus. Moreover, beta2-/- mice show an expansion of the binocular subfield of the primary visual cortex and a decrease in visual acuity at the cortical level but not in the retina. We conclude that the beta2 subunit of the nicotinic acetylcholine receptor is necessary for the anatomical and functional development of the visual system.


Figures

Figure 1
Figure 1
HRP labeling of retinogeniculate (ac) and retinocollicular (d and e) projections in adult mice. (a–c) Representative coronal sections of dLGNs in adult wild-type (WT) (a), β2−/− (b), and α4−/− (c) mice. Note the abnormal segregation of retinogeniculate afferents in β2−/− mice (dashed lines represent the borders of the dLGN; the arrow indicates the labeled area from the ipsilateral eye). (d and e) Representative rostro-caudal (from bottom to top) series of one in four coronal sections through the ipsilateral SC of adult wild-type (d) and β2−/− (e) mice. Note the abnormal distribution of ipsilateral afferents in β2−/− mice. ipsi = ipsilateral; contra = contralateral; so = stratum opticum; sgs = stratum griseum superficiale. [Scale bar (a-c) 350 μm; (d and e) 200 μm.]
Figure 2
Figure 2
HRP labeling of retinogeniculate projections in wild-type (WT) (a, c, and e) and β2−/− (b, d, and f) mice at different postnatal ages during development (a and b: P4; c and d: P9; e and f: P30), and in normal mice binocularly injected with physiological solution (g) or epibatidine (h) from P3 to P7 and analyzed at P9. Note that in β2−/− mice retinogeniculate segregation is normal at P4, but altered at P9 and P30. Abnormal segregation is also evident in mice treated with epibatidine (epib.) but not with physiological solution (physiol.). ipsi = ipsilateral; contra = contralateral. (Scale bar: 200 μm.)
Figure 3
Figure 3
(a) Sketch of the mouse visual system and stimulating apparatus. The visual field is divided in a smaller, central zone that can be seen by both eyes (binocular, B) and a larger, lateral zone that can be seen by the one eye only (monocular, M). The primary visual cortex, which contains the representation of the contrateral hemifield, is divided in a smaller, lateral area receiving the input of both eyes (OC1b), and a larger, medial area receiving the input of the contralateral eye only (OC1m). The stimulus consisted of a computer generated grating presented to the contralateral visual field. (b) Representative examples of VEP responses to stimulation of the ipsilateral and the contralateral eye, recorded from different locations of the binocular portion of the primary visual cortex (Oc1b). When the recording electrode is moved medially, the response of the ipsilateral eye tends to vanish whereas the response of the contralateral eye increases. (c and d) Representative medio-lateral cortical profile of VEP amplitude for the contralateral and the ipsilateral eye in a wild-type (WT) (c) and a β2−/− (d) mouse. The response of the ipsilateral eye is recordable at more medial cortical locations in β2−/− mice than in wild-type mice. For the contralateral eye responses in the Oc1m (at 2.3 mm for WT and 2.1 mm for β2−/−) are reported. (e) The medial border of the Oc1b area (obtained by extrapolating to 0 V the medio-lateral profile of the VEP amplitude) was significantly more medial in β2−/− mice (2.21 ± 0.05, n = 5) than in wild type (2.46 ± 0.06, n = 4). Bars represent mean ± SEM. *, P < 0.05, Student's t test. (f) Representative medio-lateral profile of the amplitude ratio between contralaterally and ipsilaterally driven responses. Ratios were evaluated from average amplitude data represented in c and d. In the wild-type mouse, when the recording electrode moves medially, the contralateral/ipsilateral VEP ratio increases dramatically, whereas in the β2−/− mouse it is less steep. In the range 3.1 to 2.7 mm from lambda, the slope of the VEP ratio is approximately linear for both wild-type and β2−/− mice. The average difference in the slope, evaluated from linear regression lines of individual mice, is statistically significant (β2−/−, n = 5; wild type, n = 4; P < 0.05, Student's t test).
Figure 4
Figure 4
(a) Representative examples of VEP amplitude changes in response to gratings of high contrast and of decreasing bar size (increasing spatial frequency) in a wild-type (WT) and a β2−/− mouse. VEP amplitude decreases by progressively increasing the spatial frequency. Visual acuity was determined by linearly extrapolating VEP amplitude to 0 V, the set of data points close to the noise level. Examples of gratings of increasing spatial frequency are shown below the abscissae. (b) Spatial resolution in the visual cortex and in the retina of wild-type and β2−/− mice. Visual acuity is significantly reduced in β2−/− mice compared with wild-type mice at the cortical (β2−/−, 0.30 ± 0.05 c/degrees, n = 9; WT, 0.59 ± 0.08 c/degrees, n = 4; *, P < 0.01, Student's t test) but not at the retinal level (β2−/−, 0.60 ± 0.07 c/degrees, n = 3; WT, 0.57 ± 0.04 c/degrees, n = 3; P > 0.05, Student's t test). Bars represent mean ± SEM. (c) Representative examples of VEP amplitude changes in response to coarse gratings (0.06 c/degrees) of decreasing contrast. VEP amplitude decreases by progressively reducing the contrast. Contrast threshold was determined by linear extrapolation of VEP amplitude to 0 V, the set of data points close to the noise level. Examples of gratings of increasing contrast are shown below the abscissae. (d) Contrast threshold is normal in β2−/− mice compared with wild type (β2−/−, 4.8 ± 0.3%, n = 4; WT, 4.6 ± 0.5%, n = 3; P > 0.05, Student's t test). Bars represent mean ± SEM.

References

    1. Shatz C J, Stryker M P. Science. 1988;242:87–89. - PubMed
    1. Sretavan D W, Shatz C J, Stryker M P. Nature (London) 1988;336:468–471. - PubMed
    1. Hahm J-O, Langdon R B, Sur M. Nature (London) 1991;351:568–570. - PubMed
    1. Katz L C, Shatz C J. Science. 1996;274:1133–1138. - PubMed
    1. Galli L, Maffei L. Science. 1988;242:90–91. - PubMed

Publication types

Substances