. 2001 May 22;98(11):6429-34.
doi: 10.1073/pnas.101122598. Epub 2001 May 8.

Targeted mutagenesis of Lis1 disrupts cortical development and LIS1 homodimerization

Affiliations

Targeted mutagenesis of Lis1 disrupts cortical development and LIS1 homodimerization

A Cahana et al. Proc Natl Acad Sci U S A. .

Abstract

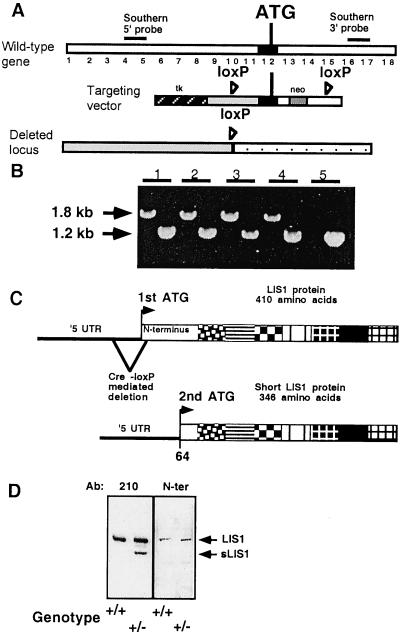
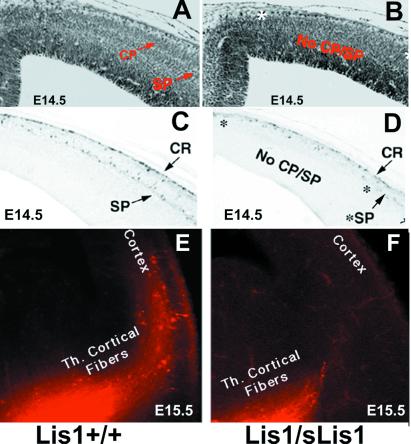
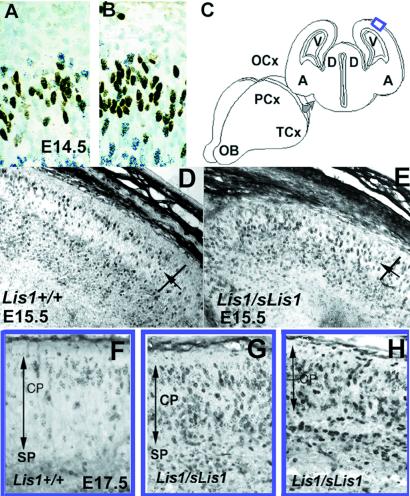
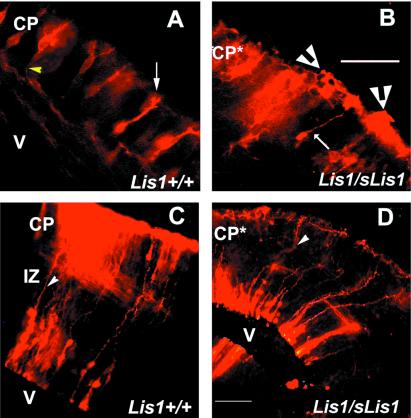
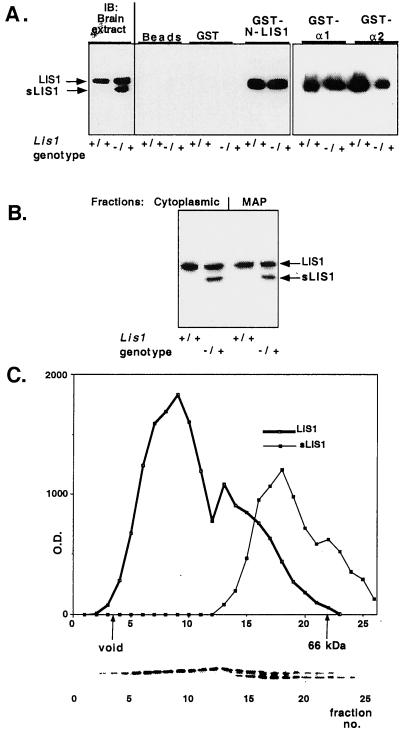
Lissencephaly is a severe brain malformation in humans. To study the function of the gene mutated in lissencephaly (LIS1), we deleted the first coding exon from the mouse Lis1 gene. The deletion resulted in a shorter protein (sLIS1) that initiates from the second methionine, a unique situation because most LIS1 mutations result in a null allele. This mutation mimics a mutation described in one lissencephaly patient with a milder phenotype. Homozygotes are early lethal, although heterozygotes are viable and fertile. Most strikingly, the morphology of cortical neurons and radial glia is aberrant in the developing cortex, and the neurons migrate more slowly. This is the first demonstration, to our knowledge, of a cellular abnormality in the migrating neurons after Lis1 mutation. Moreover, cortical plate splitting and thalomocortical innervation are also abnormal. Biochemically, the mutant protein is not capable of dimerization, and enzymatic activity is elevated in the embryos, thus a demonstration of the in vivo role of LIS1 as a subunit of PAF-AH. This mutation allows us to determine a hierarchy of functions that are sensitive to LIS1 dosage, thus promoting our understanding of the role of LIS1 in the developing cortex.


Figures

Figure 1
Figure 1
(A) Design of the Lis1-targeting construct, the endogenous locus, and the structure of the gene after deletion by Cre recombinase. The first translated exon is marked in black, and positions of the loxP sites (loxP), the first coding methionine (ATG), neomycin resistance (neo), and thymidine kinase (tk) are marked. (B) Genotyping by PCR of loxP-neo (by using two sets of primers); 1.2 kb is the wild-type allele, and 1.8 kb is the loxP-neo allele. Mice 1–4 are heterozygotes, whereas mouse 5 is wild type. (C) Schematic diagram of normal and mutated LIS1 proteins. The N-terminal portion (95 amino acids) is represented by a white box, and the seven WD tryptophane aspartic acid repeats are indicated by using boxes with different patterns. Cre-mediated deletion of the gene resulted in shortening of the 5′ untranslated region (UTR) of the transcript and the N-terminal portion of the protein. The shorter protein (345 instead of the normal 409 amino acids) initiated at the second methionine (2nd ATG) that resides within the N-terminal portion of the protein. (D) Western blot of brain extract reacted with two anti-LIS1 antibodies, 210 and N-ter. Note that only the Lis1/sLis1 animal (genotype −/+) has the second shorter protein (sLIS1). Both heterozygote and normal littermates have the normal LIS1 protein, as revealed by the two antibodies (indicated by an arrow). The anti-N-ter LIS1 polyclonal antibody was raised against a peptide from the deleted region (indicated by an arrow).
Figure 2
Figure 2
CP formation in E14.5 embryos. (A and B) Nissl stain of Lis1+/+ embryos (A) and heterozygote Lis1/sLis1 littermates (B). The positions of subplate (SP) and CP are indicated. The abnormalities in B are marked by *. The extra fold is indicated by an arrow (B and D). (C and D) Anticalretinin immunostaining of Lis1+/+ embryos (C) and heterozygous Lis1/sLis1 littermates (D). CR, Cajal–Retzius cells; v, ventricle; St, striatum. (E and F) Delay of neocortical innervation by the thalamic fibers in Lis1/sLis1. DiI fluorescence is in red. Although in the wild-type mice the thalamocortical (Th. Cortical) fibers reach the cortex (E), shorter axonal processes are seen in the heterozygotes (F).
Figure 3
Figure 3
(A and B) Interkinetic nuclear movement in the ventricular zone. BrdUrd-labeled cells that are in dark brown are in the S phase in the outer half of the ventricular zone, whereas [3H]thymidine cells that have black dots are in G2 and M and are mostly located at the ventricular surface. The position and number of the single- and double-labeled cells are similar in wild-type Lis1+/+ (A) and Lis1/sLis1 (B) embryos, indicating that both interkinetic nuclear movements and cell cycle kinetics are similar. (C) Illustration of the position of the sections (in blue box) in FH. (D, E, and F) Distribution of cells labeled with BrdUrd at E13.5 in the CP of E15.5 embryos. Sections were cut through the occipital cortex of E15.5 embryos, and the difference in the distribution of BrdUrd-labeled cells between wild type and mutants was analyzed. Although in the Lis1+/+ mice (D), most of the labeled cells (dark) are in the superficial portion of the CP, in the Lis1/sLis1 mice (E), the labeled cells are more equally distributed. The CP was marked, divided in half (the position of the division is marked by an arrow), and labeled cells counted in the superficial (CPs) and interior portions. (FH) Distribution of cells labeled with BrdUrd at E13.5 in the CP of E17.5 embryos. Sections were cut through the occipital cortex of E17.5 embryos, and the difference in the distribution of BrdUrd-labeled cells between wild type and mutants was analyzed. The width of the CP is marked by an arrow. The position of the subplate (SP) is marked as well. (F) Section in a wild-type embryo. (G and H) Sections in mutant embryos.
Figure 4
Figure 4
DiI labeling of the cortex. (A and B) E14.5 DiI labeling of cortical cells. (Bar = 1 mm.) The white arrow labels the apical dendrite, and the yellow arrowhead marks the projecting axon. Lis1+/+ (A); Lis1/sLis1, white arrow marks a neuron that has “normal” morphology, and white arrowheads mark clusters of neurons that look abnormal (B). (C and D) E15.5 DiI labeling of cortical cells. (Bar = 25 μm.) Radial glia fibers are marked with arrowheads. Lis1+/+ (E), Lis1/sLis1 (F). V, ventricle; IZ, intermediate zone; CP*, abnormal CP.
Figure 5
Figure 5
LIS1 and sLIS1 interactions. (A) sLIS1 does not homodimerize and or interact with PAF-AH catalytic subunits. LIS1 homodimerization and PAF-AH catalytic subunits: negative controls include glutathione coated agarose beads, and GST protein show the specificity of the reaction. Western blots (IB) from brain extracts of Lis1+/+ and Lis1/sLis1 (genotype −/+) mice are shown (Left) for comparison. The genotypes are marked under the panels. The interacting proteins were reacted with anti-LIS1 monoclonal antibody (clone 210). (B) sLIS1 assembles with microtubules. Distribution of LIS1 isoforms between the cytoplasmic and microtubule-associated protein fractions. Protein extracts from normal or mutant mouse brains were subjected to microtubule assembly. A representative Western blot by using anti-LIS1 antibodies is shown. The fractions: the two LIS1 isoforms and the genotypes are indicated. (C) Gel filtration analysis of LIS1 and sLIS1. sLIS1 is associated with smaller macromolecular complexes than normal LIS1. Brain extract from heterozygous Lis1/sLis1 mice was size-fractionated by a Sephadex-75 column. Proteins from each fraction were separated by SDS/PAGE and reacted with anti-LIS1 antibody (clone 210). The amount of LIS1 protein was quantified by densitometer (y axis) and plotted against fraction number (x axis). The positions of the void volume and 66 kDa (BSA) markers are shown. The distribution of the normal LIS1 is shown in a thick line, and the distribution of sLIS1is shown by a thin line. (Lower) Representative Western blot.

Similar articles

Cited by

References

    1. Reiner O, Carrozzo R, Shen Y, Whenert M, Faustinella F, Dobyns W B, Caskey C T, Ledbetter D H. Nature (London) 1993;364:717–721. - PubMed
    1. Reiner O. Mol Neurobiol. 2000;20:143–156. - PubMed
    1. des Portes V, Pinard J M, Billuart P, Vinet M C, Koulakoff A, Carrie A, Gelot A, Dupuis E, Motte J, Berwald-Netter Y, et al. Cell. 1998;92:51–61. - PubMed
    1. Gleeson J G, Allen K M, Fox J W, Lamperti E D, Berkovic S, Scheffer I, Cooper E C, Dobyns W B, Minnerath S R, Ross M E, Walsh C A. Cell. 1998;92:63–72. - PubMed
    1. Reiner O, Albrecht U, Gordon M, Chianese K A, Wong C, Sapir T, Siracusa L D, Buchberg A M, Caskey C T, Eichele G. J Neurosci. 1995;15:3730–3738. - PMC - PubMed

Publication types

Substances