Nitric oxide is protective in listeric meningoencephalitis of rats
- PMID: 11349080
- PMCID: PMC98473
- DOI: 10.1128/IAI.69.6.4086-4093.2001
Nitric oxide is protective in listeric meningoencephalitis of rats
Abstract
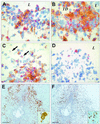
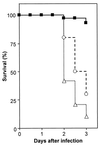
The bacterium Listeria monocytogenes causes meningoencephalitis in humans. In rodents, listeriosis is associated with granulomatous lesions in the liver and the spleen, but not with meningoencephalitis. Here, infant rats were infected intracisternally to generate experimental listeric meningoencephalitis. Dose-dependent effects of intracisternal inoculation with L. monocytogenes on survival and activity were noted; 10(4) L. monocytogenes organisms induced a self-limiting brain infection. Bacteria invaded the basal meninges, chorioid plexus and ependyme, spread to subependymal tissue and hippocampus, and disappeared by day 7. This was paralleled by recruitment and subsequent disappearance of macrophages expressing inducible nitric oxide synthase (iNOS) and nitrotyrosine accumulation, an indication of nitric oxide (NO.) production. Treatment with the spin-trapping agent alpha-phenyl-tert-butyl nitrone (PBN) dramatically increased mortality and led to bacterial numbers in the brain 2 orders of magnitude higher than in control animals. Treatment with the selective iNOS inhibitor L-N(6)-(1-iminoethyl)-lysine (L-NIL) increased mortality to a similar extent and led to 1 order of magnitude higher bacterial counts in the brain, compared with controls. The numbers of bacteria that spread to the spleen and liver did not significantly differ among L-NIL-treated, PBN-treated, and control animals. Thus, the infant rat brain is able to mobilize powerful antilisterial mechanisms, and both reactive oxygen and NO. contribute to Listeria growth control.
Figures


Similar articles
-
[The role of nitric oxide in Listeria encephalitis of ruminants and in rats intracisternally infected with Listeria monocytogenes].Berl Munch Tierarztl Wochenschr. 2002 Jul-Aug;115(7-8):259-66. Berl Munch Tierarztl Wochenschr. 2002. PMID: 12174722 German.
-
Inducible nitric oxide synthase and nitrotyrosine in listeric encephalitis: a cross-species study in ruminants.Vet Pathol. 2002 Mar;39(2):190-9. doi: 10.1354/vp.39-2-190. Vet Pathol. 2002. PMID: 12009057
-
Endogenous interleukin-10 is required for prevention of a hyperinflammatory intracerebral immune response in Listeria monocytogenes meningoencephalitis.Infect Immun. 2001 Jul;69(7):4561-71. doi: 10.1128/IAI.69.7.4561-4571.2001. Infect Immun. 2001. PMID: 11402000 Free PMC article.
-
Targeting nitric oxide and NMDA receptor-associated pathways in treatment of high grade glial tumors. Hypotheses for nitro-memantine and nitrones.Nitric Oxide. 2018 Sep 1;79:68-83. doi: 10.1016/j.niox.2017.10.001. Epub 2017 Oct 13. Nitric Oxide. 2018. PMID: 29030124 Review.
-
The pathogenesis of infection by Listeria monocytogenes.Microbiologia. 1996 Jun;12(2):245-58. Microbiologia. 1996. PMID: 8767708 Review.
Cited by
-
Nitric oxide and redox mechanisms in the immune response.J Leukoc Biol. 2011 Jun;89(6):873-91. doi: 10.1189/jlb.1010550. Epub 2011 Jan 13. J Leukoc Biol. 2011. PMID: 21233414 Free PMC article. Review.
-
Characterization of a Listeria monocytogenes meningitis mouse model.J Neuroinflammation. 2018 Sep 7;15(1):257. doi: 10.1186/s12974-018-1293-3. J Neuroinflammation. 2018. PMID: 30193592 Free PMC article.
-
Evidence for involvement of peptidoglycan in the triggering of an oxidative burst by Listeria monocytogenes in phagocytes.Clin Exp Immunol. 2005 Apr;140(1):73-80. doi: 10.1111/j.1365-2249.2005.02740.x. Clin Exp Immunol. 2005. PMID: 15762877 Free PMC article.
-
Pathogenic Differences of Type 1 Restriction-Modification Allele Variants in Experimental Listeria monocytogenes Meningitis.Front Cell Infect Microbiol. 2020 Oct 30;10:590657. doi: 10.3389/fcimb.2020.590657. eCollection 2020. Front Cell Infect Microbiol. 2020. PMID: 33194838 Free PMC article.
-
Beta-naphthoflavone causes an AhR-independent inhibition of invasion and intracellular multiplication of Listeria monocytogenes in murine hepatocytes.Microb Pathog. 2009 Nov;47(5):258-66. doi: 10.1016/j.micpath.2009.08.004. Epub 2009 Aug 26. Microb Pathog. 2009. PMID: 19715752 Free PMC article.
References
-
- Andersson A, Dai W J, Di Santo J P, Brombacher F. Early IFN-gamma production and innate immunity during Listeria monocytogenes infection in the absence of NK cells. J Immunol. 1998;161:5600–5606. - PubMed
-
- Armstrong R W, Fung P C. Brainstem encephalitis (rhombencephalitis) due to Listeria monocytogenes; case report and review Clin. Infect Dis. 1993;16:689–702. - PubMed
-
- Bancroft G J, Schreiber R D, Unanue E R. T cell-independent macrophage activation in scid mice. Curr Top Microbiol Immunol. 1989;152:235–242. - PubMed
-
- Beckerman K P, Rogers H W, Corbett J A, Schreiber R D, McDaniel M L, Unanue E R. Release of nitric oxide during the T cell-independent pathway of macrophage activation. Its role in resistance to Listeria monocytogenes. J Immunol. 1993;150:888–895. - PubMed
-
- Beckman J S, Koppenol W H. Nitric oxide, superoxide, and peroxynitrite: the good, the bad, and ugly. Am J Physiol. 1996;271:C1424–C1437. - PubMed
Publication types
MeSH terms
Substances
Grants and funding
LinkOut - more resources
Full Text Sources
Other Literature Sources
Medical

