. 2001 May 15;20(10):2575-86.
doi: 10.1093/emboj/20.10.2575.

Structure and mechanism of the RNA triphosphatase component of mammalian mRNA capping enzyme

Affiliations

Structure and mechanism of the RNA triphosphatase component of mammalian mRNA capping enzyme

A Changela et al. EMBO J. .

Abstract

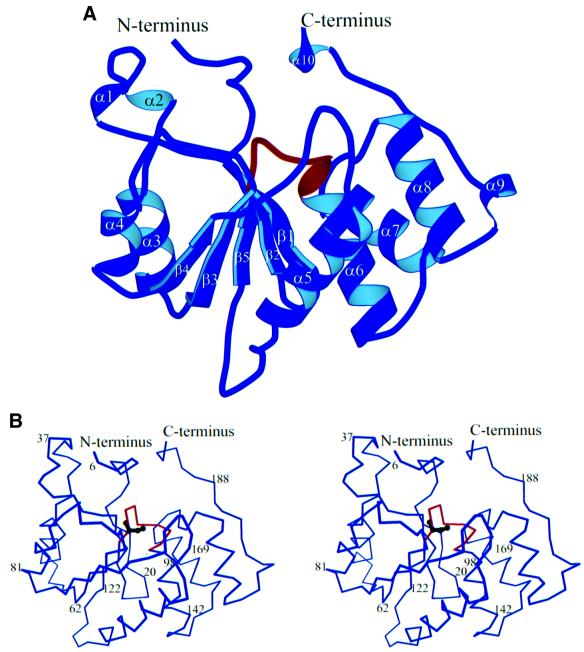
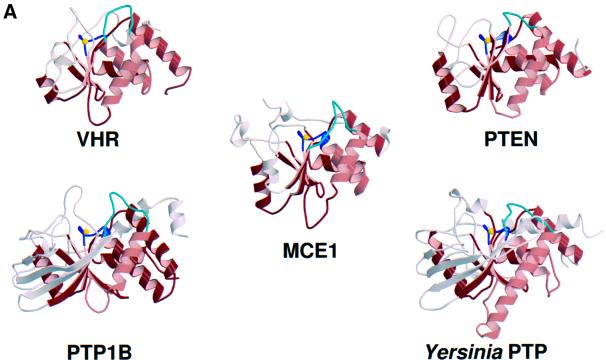
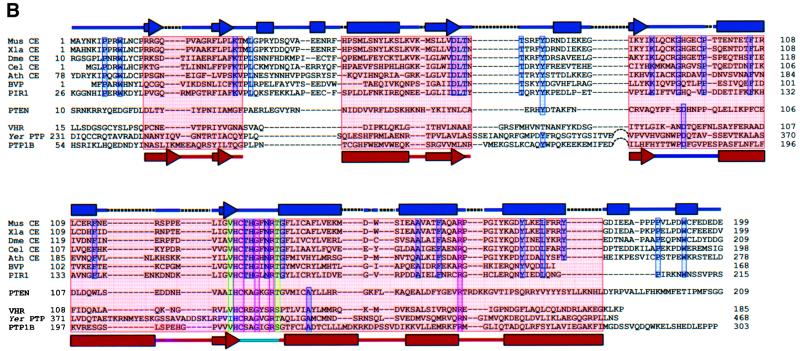
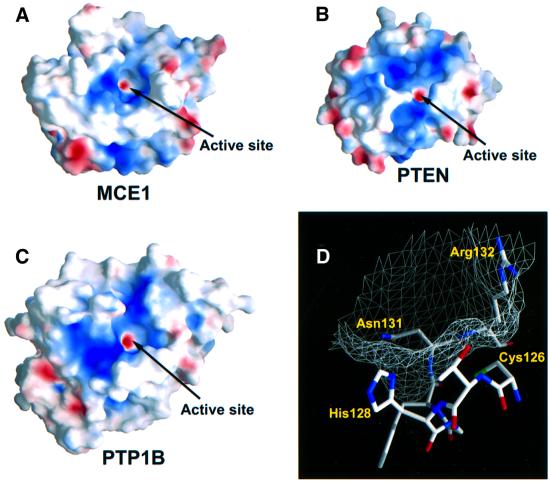
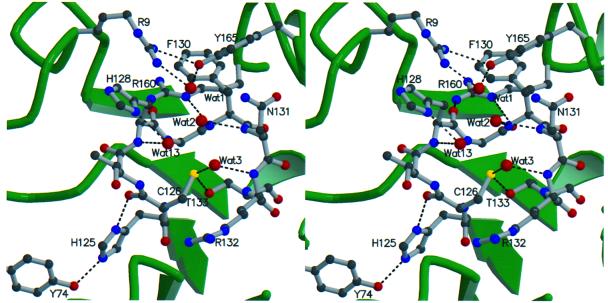
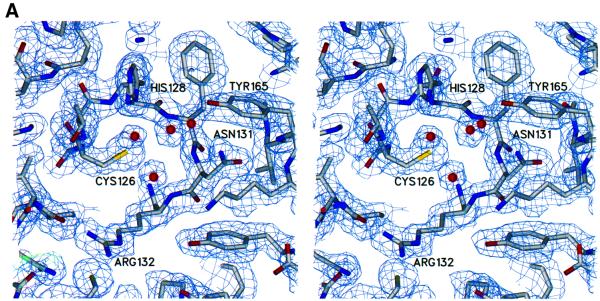
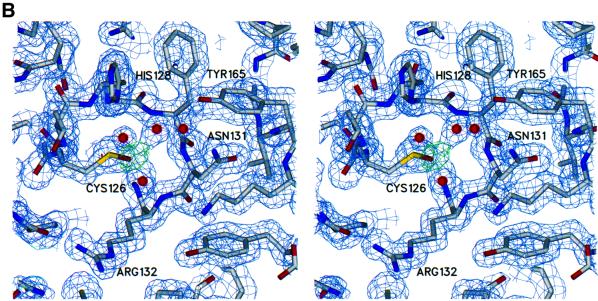
The 5' capping of mammalian pre-mRNAs is initiated by RNA triphosphatase, a member of the cysteine phosphatase superfamily. Here we report the 1.65 A crystal structure of mouse RNA triphosphatase, which reveals a deep, positively charged active site pocket that can fit a 5' triphosphate end. Structural, biochemical and mutational results show that despite sharing an HCxxxxxR(S/T) motif, a phosphoenzyme intermediate and a core alpha/beta-fold with other cysteine phosphatases, the mechanism of phosphoanhydride cleavage by mammalian capping enzyme differs from that used by protein phosphatases to hydrolyze phosphomonoesters. The most significant difference is the absence of a carboxylate general acid catalyst in RNA triphosphatase. Residues conserved uniquely among the RNA phosphatase subfamily are important for function in cap formation and are likely to play a role in substrate recognition.


Figures

None
Fig. 1. Overall structure of the Mce1 RNA triphosphatase domain. (A) Schematic representation showing the α/β-fold of the RNA triphosphatase domain (amino acids 5–194). The phosphate binding loop (P-loop) is shown in red. Secondary structural elements are labeled as α# for α-helices and β# for the β-strands. (B) Stereo view of a Cα trace of the RNA triphosphatase domain. The orientation is the same as in (A) with the P-loop colored red. The side chain of the active site cysteine, Cys126, is depicted in black.
None
Fig. 2. Comparison of the Mce1 RNA triphosphatase with other phosphatases. (A) Structural comparison of the Mce1 RNA triphosphatase domain with the dual-specificity protein phosphatase VHR, the phosphatase domain of PTEN tumor suppressor, human PTP1B and Yersinia protein tyrosine phosphatase. The P-loop is colored blue, with the active site cysteine depicted as a yellow sphere; the general acid loop is colored cyan. Other common core elements are shaded red; these consist of four twisted β-strands surrounded by four α-helices on one side and one helix on the other. (B) Structure-based sequence alignment of the Mce1 RNA triphosphatase domain with other members of the metazoan RNA triphosphatase and protein phosphatase families. For the RNA triphosphatases, the sequences were aligned based on sequence similarity, but whenever possible, insertions and deletions were confined to loop regions. To align the sequences of the protein phosphatases, the structure of the Mce1 RNA triphosphatase domain was superimposed onto the structures of the phosphatases. The common core region is highlighted in pink. Identical residues found in both families are highlighted in red, while highly conserved residues in the P-loop are in green and conserved residues within each family are blue. Structural elements of the Mce1 RNA triphosphatase are shown at the top with α-helices depicted as boxes, β-strands as arrows, insertions as dotted lines, and loops as solid lines. Structural elements representing the common core region are shown at the bottom colored the same way as in (A). The RNA triphosphatases correspond to the capping enzyme triphosphatase domains of mouse (Mus CE), Xenopus laevis (Xla CE), Drosophila melanogaster (Dme CE), Caenorhabditis elegans (Cel CE) and Arabidopsis thaliana (Ath CE), along with the baculovirus-encoded triphosphatase (BVP) and the human triphosphatase (PIR1).
None
Fig. 3. Surface representation of the Mce1 RNA triphosphatase reveals a deep, positively charged pocket similar to that found in other phosphatases. Surface electrostatic potentials of (A) Mce1 RNA triphosphatase, (B) PTEN phosphatase and (C) human PTP1B. Blue and red correspond to positively and negatively charged areas, respectively. The active site cysteine was assigned a –1 charge to reflect its presumed existence as a thiolate ion at physiological pH. The active site pocket is indicated for all the proteins. (D) Surface mesh rendering of the Mce1 catalytic region shows the overall size and depth of the active site pocket. Residues 126–132 of the P-loop are also shown.
None
Fig. 4. Stereo view of the active site region in the Mce1 RNA triphosphatase domain. The highly conserved residues of the P-loop are shown along with other conserved residues from nearby loops. Hydrogen bonding interactions within the active site are depicted by dotted lines. Water molecules are shown as red spheres.
None
Fig. 5. Demonstration of a cysteinyl phosphoenzyme. (A) pH dependence of phosphoenzyme formation. Reaction mixtures (10 µl) containing 4 µg of Mce1(1–210), 10 µM [γ-32P]ATP, 5 mM DTT and 50 mM Tris buffer [either Tris–formate (pH 3.0, 3.5), Tris–acetate (pH 4.0, 4.5, 5.0, 5.5, 6.0, 6.5) or Tris–HCl (pH 7.0, 7.5, 8.0)] were incubated at 22°C for 15 s and then quenched with 2% SDS. The samples were analyzed by SDS–PAGE. An autoradiograph of the gel is shown. The positions and sizes (kDa) of marker proteins are indicated on the left. (B) Phosphoenzyme formation by Mce1 and the isolated RNA triphosphatase domain. Reaction mixtures (10 µl) containing 50 mM Tris–acetate pH 4.0, 5 mM DTT, either 10 µM [γ-32P]ATP or [α-32P]ATP (at equivalent specific radioactivity) or 5.3 µM [γ-32P]poly(A), and 4 µg of Mce1(1–210) (lanes 1), GST–Mce1(1–210) (lanes 2) or Mce1 (lanes 3) were incubated at 22°C for 15 s. The positions of the 32P-labeled enzymes are indicated on the right. (C) Chemical stability of the phosphoenzyme. [32P]Mce1(1–210) was denatured with SDS and exposed to NaOH, hydroxylamine or iodine for 30 min at 37°C. Control samples were exposed to Tris buffer pH 7.0. The treated samples were analyzed by SDS–PAGE. An autoradiograph of the gel is shown. (D) Phosphoenzyme formation requires Cys126. Reaction mixtures (10 µl) containing 50 mM Tris–acetate pH 4.0, 5 mM DTT, either 10 µM [γ-32P]ATP or 5.3 µM [γ-32P]poly(A), and 4 µg of wild type (WT), Mce1(1–210) or Mce1(1–210)-C126S were incubated at 22°C for 15 s, then denatured and analyzed by SDS–PAGE. (E) pH dependence of ATP hydrolysis by Mce1. Reaction mixtures (10 µl) containing 4 µg of Mce1(1–210), 0.5 mM [γ-32P]ATP, 1 mM DTT and 50 mM Tris buffer [either Tris–acetate (pH 4.0, 4.5, 5.0, 5.5, 6.0, 6.5) or Tris–HCl (pH 7.0, 7.5, 8.0, 8.5, 9.0)] were incubated at 37°C for 15 min. The reactions were quenched by adding 2.5 µl of 5 M formic acid. Aliquots of the reaction mixtures were applied to polyethyleneimine cellulose TLC plates, which were developed in 0.5 M LiCl, 1 M formic acid. [γ-32P]ATP and 32Pi were quantitated by scanning the TLC plate with a phosphorimager. (F) ATP hydrolysis requires Cys126. Reaction mixtures (10 µl) containing 50 mM Tris–acetate pH 5.0, 5 mM DTT, 0.5 mM [γ-32P]ATP and wild type (WT), Mce1(1–210) or Mce1(1–210)-C126S were incubated at 37°C for 15 min. ATP hydrolysis is plotted as a function of input protein.
None
Fig. 6. Mutational effects on Mce1 RNA triphosphatase activity in vivo. (A) Complementation in yeast. Yeast strain YBS20 (cet1Δ p360-CET1 [CEN URA3 CET1]) was transformed with CEN TRP1 plasmids containing either wild-type MCE1 or the indicated mutant alleles under the control of the yeast TPI1 promoter. Individual Trp+ transformants were selected and then patched on agar medium lacking tryptophan. Cells from single patches were then streaked on agar medium containing 0.75 mg/ml 5-FOA. The plates were photographed after incubation for 4 days at 30°C. (B) Temperature-sensitive mutants. Trp+ FOA-resistant derivatives of YBS20 containing the indicated alleles of MCE1 on CEN TRP1 plasmids were streaked on YPD agar. The plates were photographed after incubation for 4 days at 25, 30 or 37°C as specified. (C) Summary of mutational effects. Lethal mutants C126S, N131A and R132A (– growth) yielded no 5-FOA-resistant colonies after incubation for 4 days at either 25 or 30°C. All of the other mutants supported growth on 5-FOA at 25 and 30°C; these were then tested for growth on YPD. Mutants R9A, D66A, H125A and T133A grew as well as wild-type MCE1 cells at 25, 30 and 37°C (+ growth). ts mutants Y74A, H128A and R160A either failed to grow or formed only pinpoint colonies at 37°C.
None
Fig. 7. Electron density of the active site in native and oxidized Mce1 RNA triphosphatase. (A) Stereo view of the experimental electron density of the active site region in the native enzyme. The map is calculated at 2.05 Å from density-modified MAD phases and is contoured at 1.2 σ. (B) Stereo view of the refined electron density at 1.7 Å of the active site region in the oxidized enzyme. The structure of the oxidized enzyme was obtained from data collected on a crystal grown in the presence of tungstate. The 2FoFc map is colored in blue and is contoured at 1.2 σ. The green FoFc map was calculated without the oxygen atom of the oxidized cysteine and is contoured at 4 σ. Cys126 is shown as a cysteine sulfenic acid.

References

    1. Barford D., Flint,A.J. and Tonks,N.K. (1994) Crystal structure of human protein tyrosine phosphatase 1B. Science, 263, 1397–1404. - PubMed
    1. Becker K., Savvides,S.N., Keese,M., Schirmer,R.H. and Karplus,P.A. (1998) Enzyme inactivation through sulfhydryl oxidation by physiologic NO-carriers. Nature Struct. Biol., 5, 267–271. - PubMed
    1. Brünger A.T. et al. (1998) Crystallography & NMR system: a new software suite for macromolecular structure determination. Acta Crystallogr. D, 54, 905–921. - PubMed
    1. CCP4 (1994) The CCP4 suite: programs for protein crystallography. Acta Crystallogr. D, 50, 760–763. - PubMed
    1. Chen W., Wilborn,M. and Rudolph,J. (2000) Dual-specific Cdc25B phosphatase: in search of the catalytic acid. Biochemistry, 39, 10781–10789. - PubMed

Publication types