. 2001 May 15;533(Pt 1):281-97.
doi: 10.1111/j.1469-7793.2001.0281b.x.

The cortical deficit in humans with strabismic amblyopia

Affiliations

The cortical deficit in humans with strabismic amblyopia

G R Barnes et al. J Physiol. .

Abstract

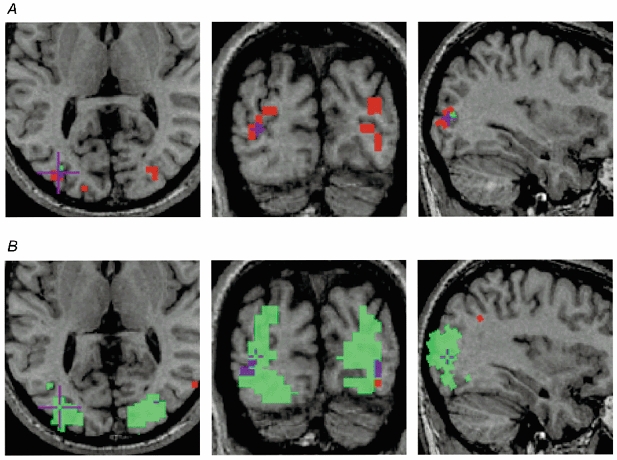
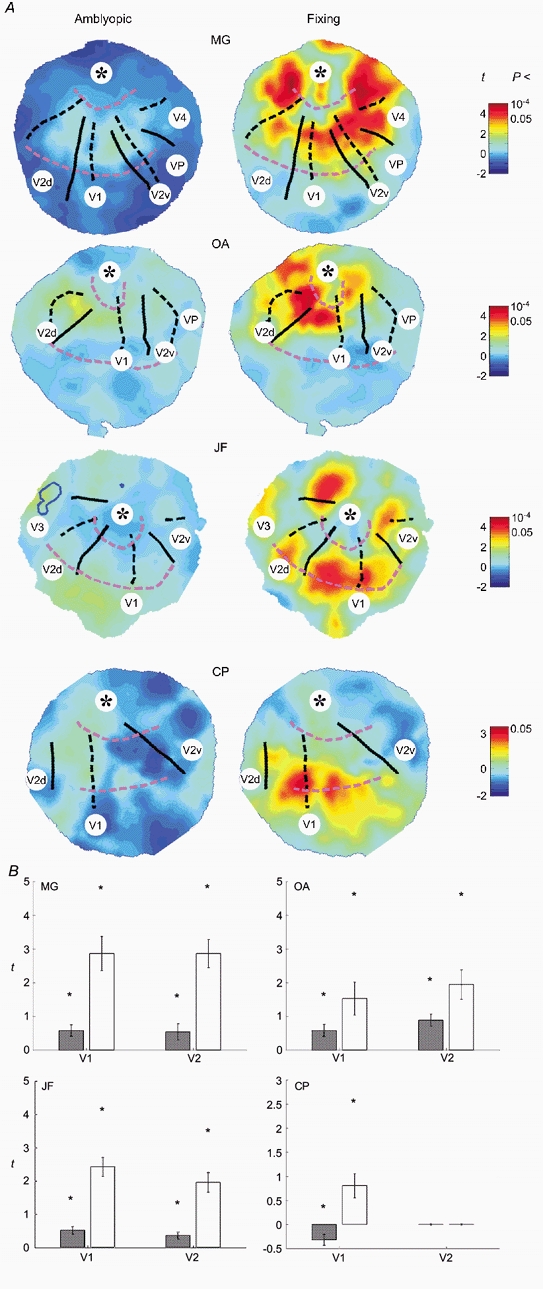
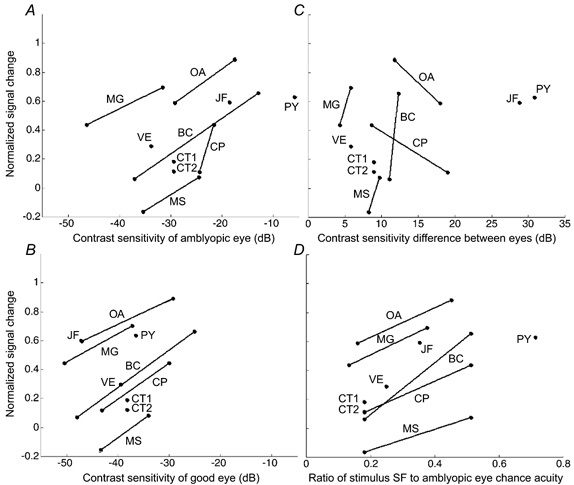
To further our understanding of the cortical deficit in strabismic amblyopia, we measured, compared and mapped functional magnetic resonance imaging (fMRI) activation between the fixing and fellow amblyopic eyes of ten strabismic amblyopes. Of specific concern was whether the function of any visual area was spared in strabismic amblyopia, as recently suggested by both positron emission tomography (PET) and fMRI studies, and whether there was a close relationship between the fMRI response and known psychophysical deficits. To answer these questions we measured the psychophysical deficit in each subject and used stimuli whose relationship to the psychophysical deficit was known. We observed that stimuli that were well within the amblyopic passband did produce reduced fMRI activation, even in visual area V1. This suggests that V1 is anomalous in amblyopia. A similar level of reduction was observed in V2. In two subjects, we found that stimuli outside the amblyopic passband produced activation in visual area V3A. We did not find a close relationship between the fMRI response reduction in amblyopia and either of the known psychophysical deficits even though the fMRI response reduction in amblyopia did covary with stimulus spatial frequency.


Figures

Figure 1
Figure 1. The generic stimulus set used in this study
All stimuli consisted of a fixation spot of radius 0.1 deg randomly changing from black to white throughout the presentation (A, B and D) and blank (C) periods. A, radial grating pattern: fixation radius, 0.1 deg; contrast, 50 %; field size, 5.4 or 26 deg; spatial frequency from 4 to 20 c.p.d.; contrast reversing at 8 Hz. B, concentrically oriented Gabors: 4 c.p.d.; σ= 0.1 deg; 50 % contrast; contrast reversing at 8 Hz; field size, 5.4 deg. C, blank period stimulus consisting of just a mean luminance screen and randomly changing fixation spot. D, the Gabors of stimulus B but with shuffled orientations.
Figure 2
Figure 2. Time course of BOLD signal change for amblyopic (red) and fixing eye (purple) stimulation for four subjects
The light and dark grey bars indicate the presentation of low (L) and high (H) spatial frequency stimuli, respectively; the bars have been delayed in time by 6 s in order to coincide with the time-lagged haemodynamic response. The open bars show the blank stimulus condition where no grating stimuli were presented. Time series were created using the voxels identified as significantly active from the average response of both eyes to the low spatial frequency stimulus. Note that in all subjects except CT the response for amblyopic, as compared to fixing eye, stimulation was reduced.
Figure 3
Figure 3. Summary of the overall activity level in the occipital cortex during amblyopic (grey bars) and fixing (open bars) eye stimulation for the ten subjects used in the study
The abscissa denotes the ratio of the stimulus spatial frequency to the spatial frequency at which the subject is at chance performance using the amblyopic eye: in A and C the stimuli were within the acuity range of the amblyopic eye, whereas in B and D the stimuli were not detectable using this eye. Two measures are presented: total number of voxels reaching significance (A and B) and mean percentage BOLD signal change (C and D). For C and D, the percentage change data are based on those voxels identified as significantly active from the average response of both eyes to the low spatial frequency stimulus. A, in all subjects except CT and MS, there was a considerable reduction in the number of voxels that reached significance when the amblyopic eye was stimulated. B, only subject JF (and possibly SB1) showed activation when the amblyopic eye was stimulated with a grating that was beyond the subject's acuity. Note that for CP, CT and VE, even during normal eye viewing of the high SF stimulus, no voxels reached the significance criterion. C, the general decrease in activity level during amblyopic eye stimulation observed in A was also seen when percentage BOLD signal change was measured. D, as in B, only subject JF showed a definitive response to a grating that was beyond his amblyopic eye's acuity.
Figure 5
Figure 5. Colour map t -statistic images for four subjects for fixing and amblyopic eye stimulation
Each panel shows the posterior portion of a single functional slice along the calcarine sulcus; typically the activity was located at the occipital pole consistent with the cortical representation of the fovea. Note that in all subjects, except CT1, there was a marked reduction in activity for amblyopic as compared to fixing eye stimulation. Figure 6. For legend see facing page.
Figure 4
Figure 4. Axial (left), coronal (middle) and sagittal (right) anatomical images of subject JF
Significant (P < 0.05) functional voxels during fixing (green) and amblyopic (red) eye stimulation are superimposed. Purple is used to show the area of overlap. A, response to the 11 c.p.d. grating. Note that this grating was beyond JF's amblopic eye acuity, yet there was significant activation when this eye was stimulated. B, the response to the 4 c.p.d. grating shows a large area of cortex driven by the fixing eye, yet relatively little detectable activation when the amblyopic eye was stimulated.
Figure 6
Figure 6. Activation across visual cortical areas
A, flattened occipital grey matter surfaces for subjects MG, OA, JF and CP overlaid with functional data from fixing (right panel) and amblyopic (left panel) eye viewing of the large field stimulus. The top of each map corresponds to the occipital pole, the centre is a point within the calcarine fundus approximately 3-4 cm anterior to the pole, the dorsal-ventral direction is left to right. The right occipital lobe is shown for all subjects except CP. The cortical loci corresponding to the horizontal meridia (black dashed), vertical meridia (black continuous) and iso-eccentricity lines (pink dashed) derived from the retinotopic mapping study are overlaid. The identifiable visual areas have been labelled. In all subjects V1 is clear, spanning the central region of each surface between the upper and lower vertical meridia (continuous lines) that mark its borders with ventral and dorsal V2 (V2v and V2d). Moving down from the approximate location of the cortical foveal representation in V1-V3 (*) the iso-eccentricity lines (pink dashed) are at 4 and 14 deg in turn. Functional data are overlaid on each surface in the form of a colour map, red and blue showing stimulus-correlated and -uncorrelated regions of activation, respectively. Note the change of colour map scale for subject CP who showed generally poorer activation. Note that in all subjects there was a global decrease in activity across all identified visual areas (including V1) when the amblyopic (left panel) rather than the fixing (right panel) eye was stimulated. In the case of subject JF, the locus of significant cortical activation during amblyopic eye stimulation from the subthreshold, small field, stimulus (see Fig. 4A) is outlined in blue on the flat map. This region is located at the V3-V3A border. B, mean t values (±s.e.m.) in visual areas V1 and V2 taken from the flat maps in A due to amblyopic (grey bars) and fixing eye (open bars) stimulation. Also shown (*) are the maximum t values within each region. Both mean and maximum t values show a significant decrease in activation during amblyopic eye stimulation. This decrease appeared to be equally marked in both V1 and V2.
Figure 7
Figure 7. Scatter plots showing the data from Fig. 3C and D replotted as normalized signal difference (see eqn (1)) between BOLD signal changes for fixing and amblyopic eye stimulation
At the ordinates 1 and -1 all measured signal change is due to the fixing eye and amblyopic eye, respectively; at zero, stimulation of each eye elicits the same level of cortical activity. For only one subject (MS) and one spatial frequency, the balance of activity favoured the amblyopic eye; typically, however, data points were at positive ordinates indicating that the fixing eye tends to dominate. In the cases where both stimuli were visible when viewed with the amblyopic eye a line joins the two data points. A, normalized signal difference plotted against the contrast sensitivity of the amblyopic eye to the stimulus. Note from the gradient of the lines that there was a consistent trend - the poorer the contrast sensitivity (hence the higher the spatial frequency of the stimulus), the more the activity favoured the fixing eye. B, normalized signal difference plotted against the contrast sensitivity of the fixing eye. The same trend as in A is clear. C, normalized signal difference plotted against the contrast sensitivity difference between eyes. Interestingly, the difference in the balance of activation between eyes did not correlate with the difference in contrast sensitivity between eyes to that stimulus. D, normalized signal difference plotted against the ratio of stimulus spatial frequency to the spatial frequency at which the subject is at chance performance when viewing with the amblyopic eye. Again, the closer the stimulus spatial frequency to the amblyopic eye acuity limit, the more the balance of activity favoured the fixing eye.

References

    1. Anderson SJ, Holliday IE, Harding GFA. Assessment of cortical dysfunction in human strabismic amblyopia using magnetoencephalography (MEG) Vision Research. 1999;39:1723–1738. - PubMed
    1. Arden GB, Barnard WB. Effect of occlusion on the visually evoked potential in amblyopia. Transactions of the Ophthalmological Society, UK. 1979;99:419–426. - PubMed
    1. Baker FH, Grigg P, von Noorden GK. Effects of visual deprivation and strabismus on the response of neurons in the visual cortex of the monkey, including studies of striate and pre-striate cortex in normal animals. Brain Research. 1974;66:185–208.
    1. Bandettini PA, Jesmanowicz A, Wong EC, Hyde JS. Processing strategies for time-course data sets in functional MRI of the human brain. Magnetic Resonance in Medicine. 1993;30:161–173. - PubMed
    1. Bedell HD, Flom MC. Monocular spatial distortion in strabismic amblyopia. Investigative Ophthalmology and Visual Science. 1981;20:263–268. - PubMed

Publication types

MeSH terms

LinkOut - more resources