. 2001 May;126(1):97-108.
doi: 10.1104/pp.126.1.97.

An early tobacco mosaic virus-induced oxidative burst in tobacco indicates extracellular perception of the virus coat protein

Affiliations

An early tobacco mosaic virus-induced oxidative burst in tobacco indicates extracellular perception of the virus coat protein

A C Allan et al. Plant Physiol. 2001 May.

Abstract

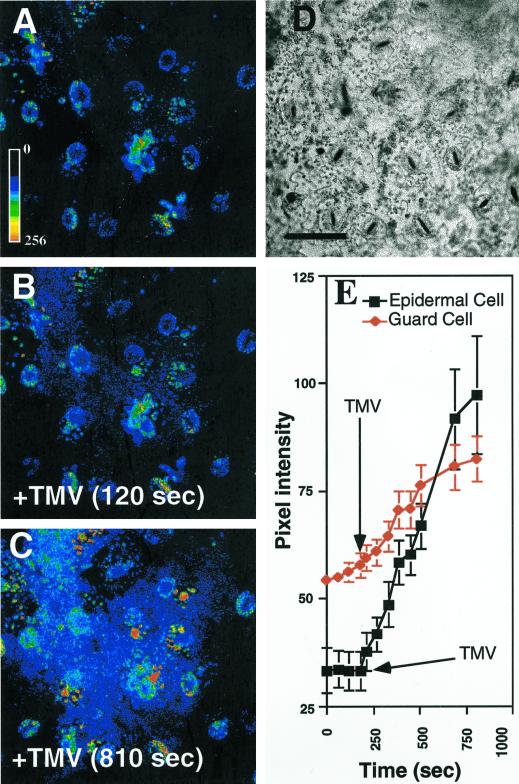
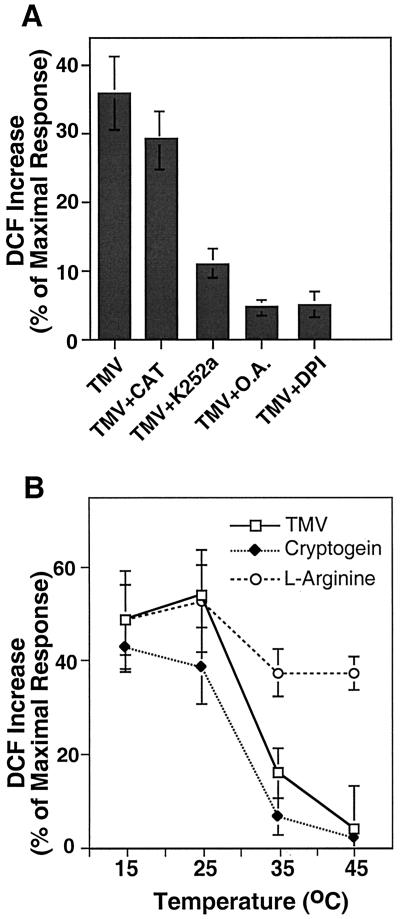
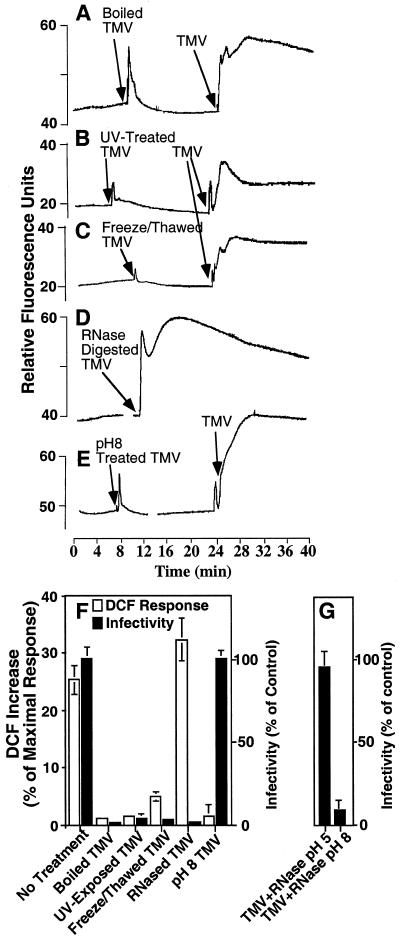
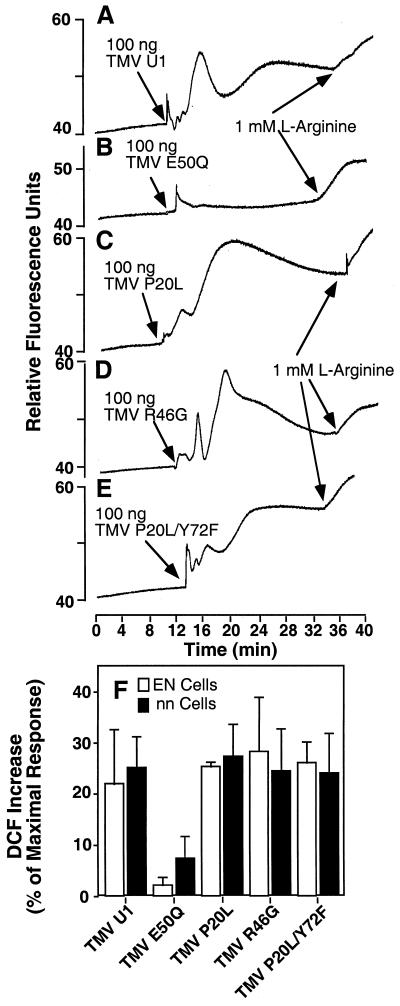
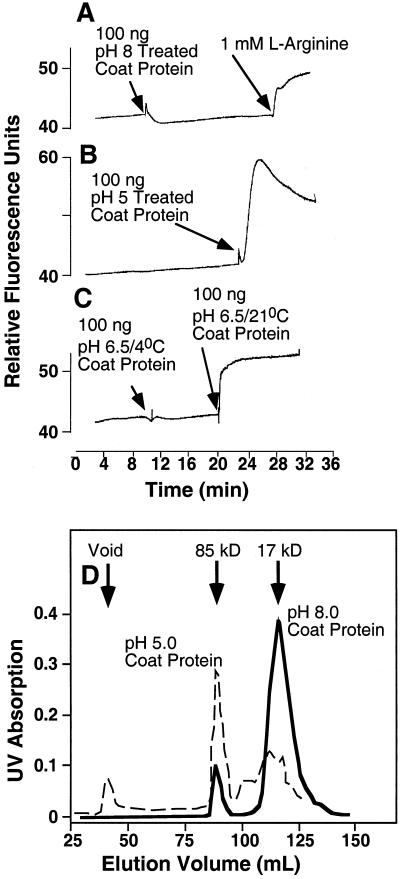
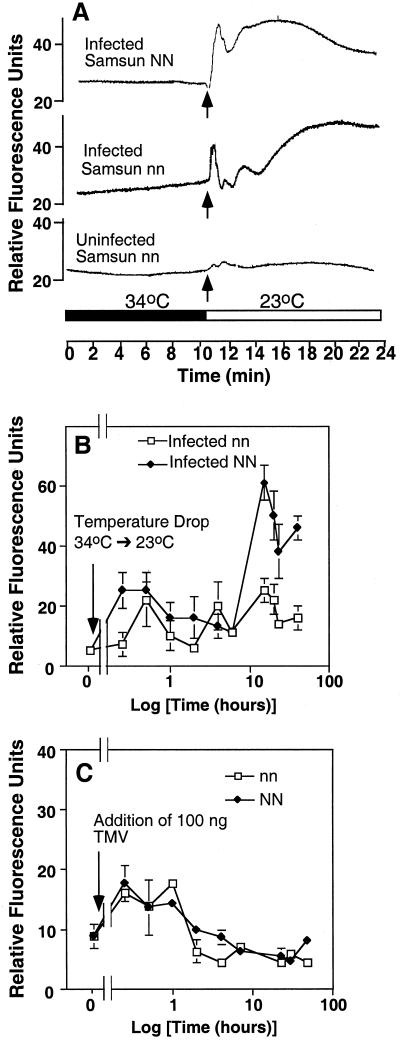
Induction of reactive oxygen species (ROS) was observed within seconds of the addition of exogenous tobacco mosaic virus (TMV) to the outside of tobacco (Nicotiana tabacum cv Samsun NN, EN, or nn) epidermal cells. Cell death was correlated with ROS production. Infectivity of the TMV virus was not a prerequisite for this elicitation and isolated coat protein (CP) subunits could also elicit the fast oxidative burst. The rapid induction of ROS was prevented by both inhibitors of plant signal transduction and inhibitors of NAD(P)H oxidases, suggesting activation of a multi-step signal transduction pathway. Induction of intracellular ROS by TMV was detected in TMV-resistant and -susceptible tobacco cultivars isogenic for the N allele. The burst was also detected with strains of virus that either elicit (ToMV) or fail to elicit (TMV U1) N' gene-mediated responses. Hence, early ROS generation is independent or upstream of known genetic systems in tobacco that can mediate hypersensitive responses. Analysis of other viruses and TMV CP mutants showed marked differences in their ability to induce ROS showing specificity of the response. Thus, initial TMV-plant cell interactions that lead to early ROS induction occur outside the plasma membrane in an event requiring specific CP epitopes.


Figures

Figure 1
Figure 1
Elicitation of rapid intracellular ROS transients by purified TMV. A, Epidermal peels from N. tabacum cv Samsun NN were loaded with DCFH-DA and monitored using fluorometry. As a control for the ability of the tissue to mount a ROS transient, l-Arg was added. B, As in A, but epidermal peels were from N. tabacum cv Samsun nn. C, As in A, but the virus added was CMV. As a control for the ability of the tissue to mount an ROS transient, TMV virus was added. D, As in C, but virus added was CGMMV. E, Dose response curve of ROS elicitation versus virus concentration using TMV or CMV and peels from N. tabacum cv Samsun NN or N. tabacum cv Samsun nn. Maximal response was recorded by the addition of 5 mm H2O2. Error bars are the mean and se of five experiments.
Figure 2
Figure 2
Laser scanning confocal imaging of the TMV-elicited oxidative burst in epidermal cells. Epidermal tissue was loaded with DCFH-DA, washed, and examined by laser scanning confocal microscopy. TMV was added during the time course of image acquisition. A, Epidermal cells loaded with DCFH-DA. The pseudocolor key is included and was applied to pixel intensity values for all three fluorescence images. B, Cells shown in A 120 s after the addition of 100 ng TMV (+TMV). C, Epidermal cells shown in A and B 810 s after addition of TMV. D, Bright field of cells shown in A through C. E, Time course of pixel intensities of selected cells. At 240 s (arrow) 100 ng of TMV was added and the pixel intensities (mean over the whole cell) of epidermal (▪) or guard (♦) cells were analyzed over the next eight captured images. Each time point represents the mean pixel intensity and se of six cells. Experiments were repeated at least six times with similar results. A through D, Scale bar = 50 μm.
Figure 3
Figure 3
The sensitivity of TMV-elicited ROS to pharmacological agents and temperature. The increase in DCF fluorescence in tobacco epidermal cells for each treatment is shown as the percentage of maximal response after the addition of 5 mm H2O2. A, DCF increase after addition of TMV (100 ng) in the presence (+) of the indicated pharmacological agents; CAT, catalase (100 units mL−1); K252a, (25 μm); O.A., okadaic acid (100 nm); DPI, diphenyleneiodonium (10 μm). B, ROS transients elicited by TMV (100 ng), cryptogein (25 ng mL−1), and l-Arg (1 mm) were carried out at temperatures ranging from 15°C to 45°C. Results are the mean and se for three replicate experiments.
Figure 4
Figure 4
Elicitation of ROS by modified virus particles. Epidermal peels were loaded with DCFH-DA and fluorescence was monitored during in-flight additions of pretreated virus (100 ng), subsequently followed by the addition of untreated TMV (100 ng, except in D). A, Boiled TMV (10 min at 105°C). B, UV-exposed TMV (30 mJ). C, Freeze-thawed TMV (20 cycles). D, RNase-treated TMV (10-min treatment; 10 μg mL−1). E, TMV held at pH 8.0 (10 mm Tris for 30 min). F and G, Increase in fluorescence after the addition of modified TMV virus. The results of three experiments are expressed as a percentage of the mean maximal response and se obtained after the addition of H2O2 (white bars). The infectivity of the virus for each treatment (black bars) is expressed as the number of lesions produced on N. tabacum cv Samsun NN leaves relative to untreated virion control.
Figure 5
Figure 5
Elicitation of ROS by mutant virus particles. Epidermal peels from N. tabacum cv Samsun nn (A–F) or N. tabacum cv Samsun EN (F) were loaded with DCFH-DA and monitored using fluorometry. Peels were exposed to 100 ng of TMV virus containing wild-type CP (U1) or mutant type CP as indicated. l-Arg (1 mm) was added as a control at the end of each experiment. Viruses used wereas follows: A, wild-type CP; B, CP E50Q; C, CP P20L; D, CP R46G; and E, CP P20L/Y72F. F, The mean increase in DCF fluorescence is shown after elicitation with each CP mutant in either N. tabacum cv Samsun NN or EN cells. The increase is expressed as the percentage of the maximal response obtained after the addition of 5 mm H2O2.
Figure 6
Figure 6
Elicitation of ROS by pH-treated TMV CP. Fluorescence of epidermal tissue was monitored during a time course in which in-flight additions were made of pretreated TMV CP (100 ng). A, TMV CP were pretreated at pH 8.0 (3 h in 10 mm Tris buffer), followed by addition of l-Arg (1 mm). B, TMV CP were pretreated at pH 5.0 (3 h in 10 mm MES buffer). C, TMV CP was treated as in A, then neutralized to pH 6.5 (3 h) at either room temperature or 4°C. D, Elution pattern of CP fractions used in A and B. The TMV CP was pretreated at pH 5.0 or 8.0 for 4 h and then resolved on a FPLC column at the same pH as the pretreatment. Calculated molecular masses of the peaks are shown.
Figure 7
Figure 7
ROS transients in pre-infected epidermal peels. Plants were inoculated (or uninfected controls) with TMV and held for 1 week at 30°C to 35°C. Peels were prepared and loaded with DCFH-DA, washed, and affixed to the peel holder at 34°C, then monitored using fluorometry. A temperature drop to 23°C was achieved at the indicated time point. A, Short-term time course of TMV infected N. tabacum cv Samsun NN, N. tabacum cv Samsun nn, and control uninfected peel tissue. B, Long-term time course (time shown on a log scale) of ROS induction after transfer of peels to room temperature. Three replicate epidermal peels from N. tabacum cv Samsun NN and N. tabacum cv Samsun nn plants treated as in A and examined at the specified time points. C, TMV addition (at arrow), during a time course (time shown on a log scale), to uninfected N. tabacum cv Samsun NN or N. tabacum cv Samsun nn peel tissue. Three replicate peels were assayed for each time point.
Figure 8
Figure 8
TMV infection of isolated epidermal cells. Epidermal peels were isolated from N. tabacum cv Samsun nn plants and floated on Suc supplemented buffer. Peels were then exposed to TMV by either floating on the virus (750 ng mL−1) constantly for the next 3 d (●), floating on the same concentration of virus for 30 min then washed before refloating on fresh buffer (▪), or exposing to TMV and PEG at the same time (□) as described in the experimental procedures. Infectivity of the peels over a time course was then tested by bioassay on N. tabacum cv Samsun NN leaves.

References

    1. Allan AC, Fluhr R. Two distinct sources of elicited reactive oxygen species in tobacco epidermal cells. Plant Cell. 1997;9:1559–1572. - PMC - PubMed
    1. Baker B, Zambryski P, Staskawicz B, Dinesh-Kumar SP. Signaling in plant-microbe interactions. Science. 1997;276:726–733. - PubMed
    1. Baker CJ, Orlandi EW. Active oxygen in plant pathogenesis. Annu Rev Phytopathol. 1995;33:299–321. - PubMed
    1. Bolwell GP, Buti VS, Davies DR, Zimmerlin A. The origin of the oxidative burst in plants. Free Radic Res. 1995;23:517–532. - PubMed
    1. Bolwell GP, Davies DR, Gerrish C, Auh CK, Murphy TM. Comparative biochemistry of the oxidative burst produced by rose and French bean cells reveals two distinct mechanisms. Plant Physiol. 1998;116:1379–1385. - PMC - PubMed

Publication types