. 2001 May 14;153(4):795-810.
doi: 10.1083/jcb.153.4.795.

Role of phosphatidylinositol 3' kinase and a downstream pleckstrin homology domain-containing protein in controlling chemotaxis in dictyostelium

Affiliations

Role of phosphatidylinositol 3' kinase and a downstream pleckstrin homology domain-containing protein in controlling chemotaxis in dictyostelium

S Funamoto et al. J Cell Biol. .

Abstract

We show that cells lacking two Dictyostelium class I phosphatidylinositol (PI) 3' kinases (PI3K and pi3k1/2-null cells) or wild-type cells treated with the PI3K inhibitor LY294002 are unable to properly polarize, are very defective in the temporal, spatial, and quantitative regulation of chemoattractant-mediated filamentous (F)-actin polymerization, and chemotax very slowly. PI3K is thought to produce membrane lipid-binding sites for localization of PH domain-containing proteins. We demonstrate that in response to chemoattractants three PH domain-containing proteins do not localize to the leading edge in pi3k1/2-null cells, and the translocation is blocked in wild-type cells by LY294002. Cells lacking one of these proteins, phdA-null cells, exhibit defects in the level and kinetics of actin polymerization at the leading edge and have chemotaxis phenotypes that are distinct from those described previously for protein kinase B (PKB) (pkbA)-null cells. Phenotypes of PhdA-dominant interfering mutations suggest that PhdA is an adaptor protein that regulates F-actin localization in response to chemoattractants and links PI3K to the control of F-actin polymerization at the leading edge during pseudopod formation. We suggest that PKB and PhdA lie downstream from PI3K and control different downstream effector pathways that are essential for proper chemotaxis.


Figures

Figure 1
Figure 1
Time-lapse recording of chemotaxis of wild-type and pi3k1/2-null cells. (A) After pulsing with cAMP, cells were transferred to glass-bottomed dishes and allowed to adhere to the bottom. A needle filled with 150 μM cAMP was placed on the bottom and is visible in the images. The movement of wild-type cells, pi3k1/2-null cells, pi3k1/2-null cells expressing PI3K1, or wild-type cells plus 30 μM LY294002 toward the cAMP source was recorded (Chung and Firtel 1999). Zero- (0; when the micropipette was inserted) and 20-min time points are shown. The insets show an enlargement of representative cell(s). (B) DIAS computer analyses. See Table for the numerical analysis. (C) Chemotaxis to folate in a Dunn chamber. Superimposed images at 1-min intervals depict the movement of these strains and give an indication of the chemotaxis efficiency. The graphs plot the change of direction ofthe leading edge relative to the cell's centroid.
Figure 3
Figure 3
Development morphology of PhdA mutant strains and deduced amino acid sequence of PhdA. (A) phdA-null cells form smaller aggregates. (B) Developmental expression pattern of PhdA. Total RNAs were isolated at the time indicated from wild-type and phdA-null cells and subjected to Northern blot analysis. White and open arrows indicate the ∼2.2- and ∼1.0-kb transcripts of PhdA, respectively. The bottom panel shows the expression pattern of cAMP receptor cAR1. (C) Sequence comparison of PhdA and CRAC (Insall et al. 1994). Asterisks indicate the sites of mutations used in this study. (D) Comparison of the PH domain of PhdA with other PH domains from Dictyostelium.
Figure 3
Figure 3
Development morphology of PhdA mutant strains and deduced amino acid sequence of PhdA. (A) phdA-null cells form smaller aggregates. (B) Developmental expression pattern of PhdA. Total RNAs were isolated at the time indicated from wild-type and phdA-null cells and subjected to Northern blot analysis. White and open arrows indicate the ∼2.2- and ∼1.0-kb transcripts of PhdA, respectively. The bottom panel shows the expression pattern of cAMP receptor cAR1. (C) Sequence comparison of PhdA and CRAC (Insall et al. 1994). Asterisks indicate the sites of mutations used in this study. (D) Comparison of the PH domain of PhdA with other PH domains from Dictyostelium.
Figure 4
Figure 4
Translocation of PhdA–GFP in response to cAMP stimulation. (A) Global stimulation of cells by dropping cAMP solution. Wild-type cells expressing the PhdA–GFP fusion protein exhibit translocation of the protein to the cell membrane (top). In contrast, PhdA–GFP expressed in pi3k1/2-null cells distributes uniformly throughout the cell after stimulation with cAMP (middle). Wild-type cells expressing PhdAR41C–GFP fusion protein exhibit no translocation of the protein after stimulation (bottom). (B) Accumulation of PhdA–GFP at the leading edge of migrating cells. Wild-type cells migrating toward cAMP source show a distinct localization of PhdA–GFP at the leading edge (top); pi3k1/2-null cells do not (middle). PhdAR41C–GFP in migrating wild-type cells localizes uniformly (bottom). Asterisks indicate the position of the tip of the micropipette containing the cAMP solution. (C) Dose–response curves of LY294002 inhibition of PhdA–GFP translocation to the plasma membrane. (D) In vitro translocation of PhdA–GFP by GTPγS (as described in Materials and Methods). Membrane fractions were collected by centrifugation and PhdA–GFP was subjected to immunological detection using an anti-GFP antibody.
Figure 5
Figure 5
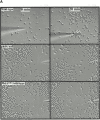
Time-lapse phase–contrast microscopy of wild-type and phdA-null cells during aggregation. Log-phase cells were washed and plated as a monolayer on nonnutrient agar plates, and aggregation was recorded as described previously (Ma et al. 1997). (A) Wild-type cells. White arrows indicate aggregation centers. Black arrows mark the outer limits of the aggregation domain. (B) phdA-null cells. phdA-null cells show a random wave pattern with multiple and less distinct aggregation centers from 4:00 to 5:40 h. Although wave patterns are observed, the cells form aberrant aggregates that break up into small distinct ones at 7:00 h.
Figure 2
Figure 2
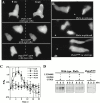
Changes in F-actin in pi3k1/2-null cells in response to chemoattractant stimulation. (A) F-actin levels in wild-type, pi3k1/2-null cells, and wild-type cells plus 30 μM LY294002 after cAMP stimulation. The F-actin content was determined as described previously (Chung et al. 2000). (Wild-type cells treated with 10 μM LY294002 showed little effect on changes in F-actin; 30 and 60 μM had similar effects; 90 μM had a slightly greater effect [see Fig. 4 C; data not shown].) (Ba) Cells expressing GFP-coronin were globally stimulated with saturating (μM) levels of cAMP. Changes in the localization of GFP-coronin, as determined by fluorescence, were followed as described in Materials and Methods. (Wild-type cells treated for 10 min with LY294002 are round in the absence of a cAMP gradient.) (Bb) Kinetics of GFP-coronin translocation to the membrane after cAMP stimulation. Intensity of fluorescence on the membrane was measured using Metamorph software. Graph shows increase fold calculated by dividing intensity before stimulation (E 0) by intensity at each time point (E). (Bc) Intensity profiles of images in Ba. (Ca) Translocation of coronin in response to changes in the position of the micropipette containing cAMP. Placing the tip of a micropipette filled with 150 μM cAMP near the cell causes the accumulation of GFP-coronin at the edge of the cell closest to the tip and the formation of a new pseudopod. Changing the position of the tip to the opposite side results in the formation of new pseudopodia enriched in GFP-coronin and a retraction of the old pseudopod. Asterisks indicate the position of the micropipette. Open arrow indicates retracting pseudopod; white arrow indicates new pseudopod. (Cb) Kinetics of translocation of coronin. The graph shows fold increase calculated by dividing intensity before stimulation (E 0) by intensity at each time point (E).
Figure 2
Figure 2
Changes in F-actin in pi3k1/2-null cells in response to chemoattractant stimulation. (A) F-actin levels in wild-type, pi3k1/2-null cells, and wild-type cells plus 30 μM LY294002 after cAMP stimulation. The F-actin content was determined as described previously (Chung et al. 2000). (Wild-type cells treated with 10 μM LY294002 showed little effect on changes in F-actin; 30 and 60 μM had similar effects; 90 μM had a slightly greater effect [see Fig. 4 C; data not shown].) (Ba) Cells expressing GFP-coronin were globally stimulated with saturating (μM) levels of cAMP. Changes in the localization of GFP-coronin, as determined by fluorescence, were followed as described in Materials and Methods. (Wild-type cells treated for 10 min with LY294002 are round in the absence of a cAMP gradient.) (Bb) Kinetics of GFP-coronin translocation to the membrane after cAMP stimulation. Intensity of fluorescence on the membrane was measured using Metamorph software. Graph shows increase fold calculated by dividing intensity before stimulation (E 0) by intensity at each time point (E). (Bc) Intensity profiles of images in Ba. (Ca) Translocation of coronin in response to changes in the position of the micropipette containing cAMP. Placing the tip of a micropipette filled with 150 μM cAMP near the cell causes the accumulation of GFP-coronin at the edge of the cell closest to the tip and the formation of a new pseudopod. Changing the position of the tip to the opposite side results in the formation of new pseudopodia enriched in GFP-coronin and a retraction of the old pseudopod. Asterisks indicate the position of the micropipette. Open arrow indicates retracting pseudopod; white arrow indicates new pseudopod. (Cb) Kinetics of translocation of coronin. The graph shows fold increase calculated by dividing intensity before stimulation (E 0) by intensity at each time point (E).
Figure 6
Figure 6
Chemotaxis of PhdA mutant strains to a cAMP source. (A) Chemotaxis of phdA-null cells to a micropipette filled with cAMP (see legend to Fig. 1; the wild-type panels are the same as those in Fig. 1 and are added as a comparison). Wild-type cells expressing PhdAR41C partially phenocopy the phdA-null phenotype. (B) Leading edge of the phdA-null cell. The leading edge of a migrating wild-type cell is smooth, but the phdA-null cell forms multiple spike structures at the leading edge. Wild-type cells expressing PhdAR41C exhibit similar projections. Arrows indicate leading edge protrusions. (C) DIAS computer analyses of phdA mutants (see legend to Fig. 1). phdA-null cells exhibit more changes of direction than wild-type cells. Wild-type cells expressing PhdAR41C exhibit a reduction in elongation and movement and an increase in the change of direction as phdA-null cells.
Figure 6
Figure 6
Chemotaxis of PhdA mutant strains to a cAMP source. (A) Chemotaxis of phdA-null cells to a micropipette filled with cAMP (see legend to Fig. 1; the wild-type panels are the same as those in Fig. 1 and are added as a comparison). Wild-type cells expressing PhdAR41C partially phenocopy the phdA-null phenotype. (B) Leading edge of the phdA-null cell. The leading edge of a migrating wild-type cell is smooth, but the phdA-null cell forms multiple spike structures at the leading edge. Wild-type cells expressing PhdAR41C exhibit similar projections. Arrows indicate leading edge protrusions. (C) DIAS computer analyses of phdA mutants (see legend to Fig. 1). phdA-null cells exhibit more changes of direction than wild-type cells. Wild-type cells expressing PhdAR41C exhibit a reduction in elongation and movement and an increase in the change of direction as phdA-null cells.
Figure 7
Figure 7
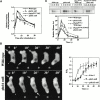
Regulation of F-actin in phdA-null cells. (A) F-actin levels in wild-type cells, phdA-null cells, wild-type cells expressing PhdAR41C, phdA-null cells expressing PhdA, and pkbA-null cells after cAMP stimulation. See the legend to Fig. 2 for details. (B) Kinetics of GFP-coronin translocation in phdA-null cells (see legend to Fig. 2). The asterisks indicate the position of the micropipette containing the chemoattractant. The black arrow indicates the retracting pseudopod, and the white arrow indicates the new pseudopod. The data for wild-type and pi3k1/2-null cells are taken from Fig. 2. The graph represents an averaging of five cells from the same experiment. The experiment was repeated several times on the same day and three different times on different days; all experiments produced comparable results. (C) cAMP-mediated PKB kinase activity. PKB activity was tested according to Meili et al. (1999). PKB protein levels were determined in these samples using Western blot analysis (Meili et al. 1999).

References

    1. Allen W.E., Zicha D., Ridley A.J., Jones G.E. A role for Cdc42 in macrophage chemotaxis. J. Cell Biol. 1998;141:1147–1157. - PMC - PubMed
    1. Andjelkovic M., Alessi D.R., Meier R., Fernandez A., Lamb N.J., Frech M., Cron P., Cohen P., Lucocq J.M., Hemmings B.A. Role of translocation in the activation and function of protein kinase B. J. Biol. Chem. 1997;272:31515–31524. - PubMed
    1. Brunet A., Bonni A., Zigmond M.J., Lin M.Z., Juo P., Hu L.S., Anderson M.J., Arden K.C., Blenis J., Greenberg M.E. Akt promotes cell survival by phosphorylating and inhibiting a forkhead transcription factor. Cell. 1999;96:857–868. - PubMed
    1. Buczynski G., Grove B., Nomura A., Kleve M., Bush J., Firtel R.A., Cardelli J. Inactivation of two Dictyostelium discoideum genes, DdPIK1 and DdPIK2, encoding proteins related to mammalian phosphatidylinositide 3-kinases, results in defects in endocytosis, lysosome to postlysosome transport, and actin cytoskeleton organization. J. Cell Biol. 1997;136:1271–1286. - PMC - PubMed
    1. Carboni J.M., Condeelis J.S. Ligand-induced changes in the location of actin, myosin, 95K (alpha-actinin), and 120K protein in amebae of Dictyostelium discoideum . J. Cell Biol. 1985;100:1884–1893. - PMC - PubMed

Publication types

MeSH terms