. 2001 May 14;153(4):823-34.
doi: 10.1083/jcb.153.4.823.

A central role for the armadillo protein plakoglobin in the autoimmune disease pemphigus vulgaris

Affiliations

A central role for the armadillo protein plakoglobin in the autoimmune disease pemphigus vulgaris

R Caldelari et al. J Cell Biol. .

Abstract

In pemphigus vulgaris (PV), autoantibody binding to desmoglein (Dsg) 3 induces loss of intercellular adhesion in skin and mucous membranes. Two hypotheses are currently favored to explain the underlying molecular mechanisms: (a) disruption of adhesion through steric hindrance, and (b) interference of desmosomal cadherin-bound antibody with intracellular events, which we speculated to involve plakoglobin. To investigate the second hypothesis we established keratinocyte cultures from plakoglobin knockout (PG-/-) embryos and PG+/+ control mice. Although both cell types exhibited desmosomal cadherin-mediated adhesion during calcium-induced differentiation and bound PV immunoglobin (IgG) at their cell surface, only PG+/+ keratinocytes responded with keratin retraction and loss of adhesion. When full-length plakoglobin was reintroduced into PG-/- cells, responsiveness to PV IgG was restored. Moreover, in these cells like in PG+/+ keratinocytes, PV IgG binding severely affected the linear distribution of plakoglobin at the plasma membrane. Taken together, the establishment of an in vitro model using PG+/+ and PG-/- keratinocytes allowed us (a) to exclude the steric hindrance only hypothesis, and (b) to demonstrate for the first time that plakoglobin plays a central role in PV, a finding that will provide a novel direction for investigations of the molecular mechanisms leading to PV, and on the function of plakoglobin in differentiating keratinocytes.


Figures

Figure 1
Figure 1
Calcium-induced desmosomal cadherin-mediated adhesion in PG+/+ and PG−/− keratinocytes. (a) Dsg 3 and plakoglobin expression after 6 h of culture in high calcium-containing medium was assessed by double labeling IF microscopy (green fluorescence: anti-Dsg 3; red fluorescence: antiplakoglobin [PG]; yellow staining in the overlay: colocalization of Dsg 3 and plakoglobin). (b) At the same time point as in panel a, coprecipitation studies were performed using antibody against keratin 14 (IP, K14) on 1 mg of RIPA buffer lysates. As a control for specificity, the same amount of lysates was precipitated with either antibody against E-cad or beads alone. 7.5 μg of the used lysates was analyzed in parallel. The same blot was consecutively probed without stripping with antibodies against E-cad, Dsg 3, plakoglobin (PG), and plakophilin 1 (PPh 1). The upper band in the E-cad immunoprecipitates is likely to represent unprocessed E-cad (Posthaus et al. 1998). The arrowhead points at remaining E-cad signal in the blot probed with Dsg 3. Low amounts of plakoglobin in the E-cad precipitate were detected after extended exposure (data not shown).
Figure 1
Figure 1
Calcium-induced desmosomal cadherin-mediated adhesion in PG+/+ and PG−/− keratinocytes. (a) Dsg 3 and plakoglobin expression after 6 h of culture in high calcium-containing medium was assessed by double labeling IF microscopy (green fluorescence: anti-Dsg 3; red fluorescence: antiplakoglobin [PG]; yellow staining in the overlay: colocalization of Dsg 3 and plakoglobin). (b) At the same time point as in panel a, coprecipitation studies were performed using antibody against keratin 14 (IP, K14) on 1 mg of RIPA buffer lysates. As a control for specificity, the same amount of lysates was precipitated with either antibody against E-cad or beads alone. 7.5 μg of the used lysates was analyzed in parallel. The same blot was consecutively probed without stripping with antibodies against E-cad, Dsg 3, plakoglobin (PG), and plakophilin 1 (PPh 1). The upper band in the E-cad immunoprecipitates is likely to represent unprocessed E-cad (Posthaus et al. 1998). The arrowhead points at remaining E-cad signal in the blot probed with Dsg 3. Low amounts of plakoglobin in the E-cad precipitate were detected after extended exposure (data not shown).
Figure 2
Figure 2
Calcium-induced adhesive strength in PG+/+ and PG−/− keratinocytes. (a) The intercellular adhesive strength between keratinocytes in low calcium (LowCa2+) medium, after 30 h in high calcium (HighCa2+) medium, or reversed to low calcium medium (back switch: 6 h high calcium, 24 h low calcium) was quantified by the adhesion assay. Time points corresponded with subsequent incubation times used in experiments with PV IgG (see Fig. 4 c). Results of two experiments done in triplicate are presented as the counts of total over single cells, indicative of intercellular adhesive strength. PG+/+, *P = 0.003; PG−/− , *P = 0.004; PG+/+ vs. PG−/− in low calcium, °P = 0.008. Bars represent standard deviations. (b) 15 μg of total cell lysates from PG+/+ and PG−/− keratinocytes grown under low calcium or high calcium concentrations (chosen time points are relevant for PV IgG stimulations) was assessed for Dsg 3 and Dsg 1 expression using WB. The same amount of total cell lysate from a canine squamous cell carcinoma cell line (SCCA) overexpressing Dsg 1 (de Bruin et al. 1999) was used as a control to illustrate Dsg 1 steady-state level in a cell that does not respond to PV IgG with keratin retraction (data not shown). Note that the Dsg 3 antibody raised against mouse EC5 domain has low avidity for canine Dsg 3.
Figure 2
Figure 2
Calcium-induced adhesive strength in PG+/+ and PG−/− keratinocytes. (a) The intercellular adhesive strength between keratinocytes in low calcium (LowCa2+) medium, after 30 h in high calcium (HighCa2+) medium, or reversed to low calcium medium (back switch: 6 h high calcium, 24 h low calcium) was quantified by the adhesion assay. Time points corresponded with subsequent incubation times used in experiments with PV IgG (see Fig. 4 c). Results of two experiments done in triplicate are presented as the counts of total over single cells, indicative of intercellular adhesive strength. PG+/+, *P = 0.003; PG−/− , *P = 0.004; PG+/+ vs. PG−/− in low calcium, °P = 0.008. Bars represent standard deviations. (b) 15 μg of total cell lysates from PG+/+ and PG−/− keratinocytes grown under low calcium or high calcium concentrations (chosen time points are relevant for PV IgG stimulations) was assessed for Dsg 3 and Dsg 1 expression using WB. The same amount of total cell lysate from a canine squamous cell carcinoma cell line (SCCA) overexpressing Dsg 1 (de Bruin et al. 1999) was used as a control to illustrate Dsg 1 steady-state level in a cell that does not respond to PV IgG with keratin retraction (data not shown). Note that the Dsg 3 antibody raised against mouse EC5 domain has low avidity for canine Dsg 3.
Figure 3
Figure 3
Characterization of PV IgG. (a) WB strips containing 20 μg of human epidermal extract were probed with PV IgG 1 (0.375 mg/ml), the same concentration of control nhIgG or antibodies directed against Dsg 3 or Dsg 1/2. (b) The main antigenic target of PV IgG was identified by immunoblots with recombinant baculovirus-expressed human Dsg 3-IgG1 or Dsg 1-IgG1 (rDsg 3, rDsg 1) incubated with PV IgG 1 (0.375 mg/ml), or nhIgG followed by alkaline phosphatase–coupled anti–human IgG4 (Southern Biotechnology Associates, Inc.). As control for equal loading, the same quantity of recombinant protein was assessed in parallel with anti–human IgG (H+L; Bio-Rad Laboratories). Note that PV IgG 1 recognizes recombinant Dsg 3 but not Dsg 1, which is consistent with the antibody profile detected by ELISA (see Materials and Methods). Reproduced from Müller et al., 2000, with the permission of Verlag Hans Hüber, Bern, Switzerland.
Figure 3
Figure 3
Characterization of PV IgG. (a) WB strips containing 20 μg of human epidermal extract were probed with PV IgG 1 (0.375 mg/ml), the same concentration of control nhIgG or antibodies directed against Dsg 3 or Dsg 1/2. (b) The main antigenic target of PV IgG was identified by immunoblots with recombinant baculovirus-expressed human Dsg 3-IgG1 or Dsg 1-IgG1 (rDsg 3, rDsg 1) incubated with PV IgG 1 (0.375 mg/ml), or nhIgG followed by alkaline phosphatase–coupled anti–human IgG4 (Southern Biotechnology Associates, Inc.). As control for equal loading, the same quantity of recombinant protein was assessed in parallel with anti–human IgG (H+L; Bio-Rad Laboratories). Note that PV IgG 1 recognizes recombinant Dsg 3 but not Dsg 1, which is consistent with the antibody profile detected by ELISA (see Materials and Methods). Reproduced from Müller et al., 2000, with the permission of Verlag Hans Hüber, Bern, Switzerland.
Figure 4
Figure 4
PV IgG stimulation of PG+/+ and PG−/− keratinocytes. (a) Binding of PV IgG and control nhIgG to the cellular surface of PG−/− and PG+/+ keratinocytes was assessed by IF microscopy of in vivo–labeled cells after 6 h of culture in high calcium-containing medium. (b) Keratin retraction from cell–cell borders was compared between PG+/+ and PG−/− by IF microscopy using the pan-keratin antibody on keratinocyte cultures held for 6 h in high calcium before stimulation with PV IgG 1, 2, and 3 or nhIgG for 24 h. Insets: magnification of intercellular areas. (c) Loss of intercellular adhesiveness between keratinocytes incubated with PV IgG 1 or nhIgG for 24 h was quantified in the adhesion assay. Two independent experiments were done in triplicate for each cell type. Bars represent standard deviations. *P = 0.004.
Figure 4
Figure 4
PV IgG stimulation of PG+/+ and PG−/− keratinocytes. (a) Binding of PV IgG and control nhIgG to the cellular surface of PG−/− and PG+/+ keratinocytes was assessed by IF microscopy of in vivo–labeled cells after 6 h of culture in high calcium-containing medium. (b) Keratin retraction from cell–cell borders was compared between PG+/+ and PG−/− by IF microscopy using the pan-keratin antibody on keratinocyte cultures held for 6 h in high calcium before stimulation with PV IgG 1, 2, and 3 or nhIgG for 24 h. Insets: magnification of intercellular areas. (c) Loss of intercellular adhesiveness between keratinocytes incubated with PV IgG 1 or nhIgG for 24 h was quantified in the adhesion assay. Two independent experiments were done in triplicate for each cell type. Bars represent standard deviations. *P = 0.004.
Figure 5
Figure 5
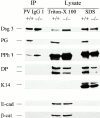
Dsg 3 complexes and the distribution of soluble and insoluble proteins in PG+/+ and PG−/− cells. 1 mg of Triton X-100–soluble cell lysate was coprecipitated with 75 μg PV IgG 1 (IP PV IgG 1) and analyzed by immunoblotting. 20 μg of the lysates used for immunoprecipitation was loaded as control for protein composition (Triton X-100) and compared with the same portion of the corresponding cytoskeletal fraction (SDS). The same blot was probed consecutively with the indicated antibodies. PPh1, plakophilin 1; DP, Desmoplakin I + II; K14, keratin 14; β-cat, β-catenin. Note that the specificity of the coprecipitation reaction and the purity of the SDS fraction are demonstrated by the absence of E-cad and β-catenin from the immunoprecipitation reaction and the SDS lysates.
Figure 7
Figure 7
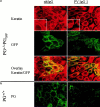
Responsiveness of PGGFP-expressing PG−/− keratinocytes to PV IgG. (a) Keratin retraction from the cell borders in transfected or control keratinocytes expressing GFP alone was demonstrated by IF studies on keratinocyte cultures held for 6 h in high calcium medium before stimulation with PV IgG 1 or nhIgG for 24 h (green fluorescence: anti-PG; red fluorescence: anti–pan-keratin). Expression of proteins can be considered as semi-quantitative because staining conditions and photographic exposures were held unchanged. Insets: magnification of intercellular areas. (b) Loss of intercellular adhesiveness in PV IgG 1– or nhIgG-treated cells for 24 h was quantified by the adhesion assay. Each experiment was done in triplicate. Bars represent standard deviations. *P = 0.004.
Figure 7
Figure 7
Responsiveness of PGGFP-expressing PG−/− keratinocytes to PV IgG. (a) Keratin retraction from the cell borders in transfected or control keratinocytes expressing GFP alone was demonstrated by IF studies on keratinocyte cultures held for 6 h in high calcium medium before stimulation with PV IgG 1 or nhIgG for 24 h (green fluorescence: anti-PG; red fluorescence: anti–pan-keratin). Expression of proteins can be considered as semi-quantitative because staining conditions and photographic exposures were held unchanged. Insets: magnification of intercellular areas. (b) Loss of intercellular adhesiveness in PV IgG 1– or nhIgG-treated cells for 24 h was quantified by the adhesion assay. Each experiment was done in triplicate. Bars represent standard deviations. *P = 0.004.
Figure 6
Figure 6
Cellular distribution of ectopically expressed, full length plakoglobin-GFP (PGGFP) in PG−/− cells. (a) Colocalization of PGGFP and PV IgG 1-antigenic target was assessed by IF analysis of PG−/− PGGFP cells after 6 h of culture in high calcium medium. GFP-expressing cells served as control (red fluorescence: mouse anti–human IgG4 and anti–mouse IgG coupled to Texas red). PGGFP and GFP were detected due to intrinsic fluorescence (green fluorescence). Fixation was omitted to demonstrate surface-exposed PV antigen and localization of nonanchored GFP. (b) Ectopic PGGFP expression in PG−/− cells was assessed at the indicated time points during calcium-induced differentiation using WB of the soluble and corresponding cytoskeletal fraction. The top panel depicts steady-state levels of PGGFP protein revealed with plakoglobin antibody and the bottom panel incubations of the same blot with tubulin or keratin 14 (K14) antibodies used as loading controls. Bars indicate the molecular weight markers (in kD).
Figure 6
Figure 6
Cellular distribution of ectopically expressed, full length plakoglobin-GFP (PGGFP) in PG−/− cells. (a) Colocalization of PGGFP and PV IgG 1-antigenic target was assessed by IF analysis of PG−/− PGGFP cells after 6 h of culture in high calcium medium. GFP-expressing cells served as control (red fluorescence: mouse anti–human IgG4 and anti–mouse IgG coupled to Texas red). PGGFP and GFP were detected due to intrinsic fluorescence (green fluorescence). Fixation was omitted to demonstrate surface-exposed PV antigen and localization of nonanchored GFP. (b) Ectopic PGGFP expression in PG−/− cells was assessed at the indicated time points during calcium-induced differentiation using WB of the soluble and corresponding cytoskeletal fraction. The top panel depicts steady-state levels of PGGFP protein revealed with plakoglobin antibody and the bottom panel incubations of the same blot with tubulin or keratin 14 (K14) antibodies used as loading controls. Bars indicate the molecular weight markers (in kD).
Figure 8
Figure 8
Ectopic and endogenous plakoglobin distribution in PV IgG–treated PG+/+ cells. (a) Retrovirus-encoded PGGFP was assessed in IF studies after 24 h stimulation with PV IgG 1 (green fluorescence: anti-GFP; red fluorescence: anti–pan-keratin). (b) Using a plakoglobin antibody distribution of endogenous plakoglobin (PG) including loss of the fluorescence signal was demonstrated in normal PG+/+ cells after 24 h of PV IgG 1 stimulation. Staining conditions and photographic exposures were held unchanged for all micrographs.

Similar articles

Cited by

References

    1. Amagai M. Adhesion molecules. IKeratinocyte-keratinocyte interactions; cadherins and pemphigus. J. Invest. Dermatol. 1995;104:146–152. - PubMed
    1. Amagai M., Karpati S., Prussick R., Klaus-Kovtun V., Stanley J.R. Autoantibodies against the amino-terminal cadherin-like binding domain of pemphigus vulgaris antigen are pathogenic. J. Clin. Invest. 1992;90:919–926. - PMC - PubMed
    1. Amagai M., Hashimoto T., Shimizu N., Nishikawa T. Absorption of pathogenic autoantibodies by the extracellular domain of pemphigus vulgaris antigen (Dsg3) produced by baculovirus. J. Clin. Invest. 1994;94:59–67. - PMC - PubMed
    1. Amagai M., Komai A., Hashimoto T., Shirakata Y., Hashimoto K., Yamada T., Kitajima Y., Ohya K., Iwanami H., Nishikawa T. Usefulness of enzyme-linked immunosorbent assay using recombinant desmogleins 1 and 3 for serodiagnosis of pemphigus. Br. J. Dermatol. 1999;140:351–357. - PubMed
    1. Anhalt G.J., Labib R.S., Voorhees J.J., Beals T.F., Diaz L.A. Induction of pemphigus in neonatal mice by passive transfer of IgG from patients with the disease. N. Engl. J. Med. 1982;306:1189–1196. - PubMed

Publication types

MeSH terms