. 2001 May 14;153(4):881-8.
doi: 10.1083/jcb.153.4.881.

Nascent focal adhesions are responsible for the generation of strong propulsive forces in migrating fibroblasts

Affiliations

Nascent focal adhesions are responsible for the generation of strong propulsive forces in migrating fibroblasts

K A Beningo et al. J Cell Biol. .

Abstract

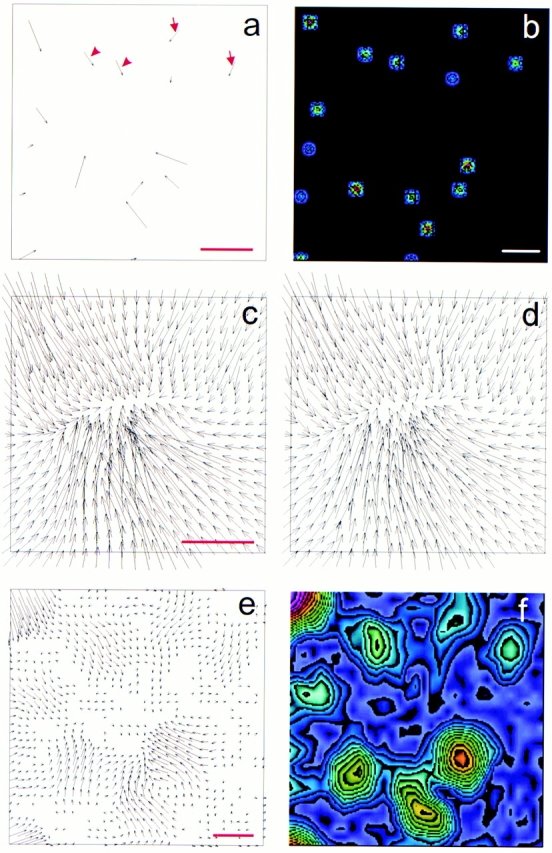
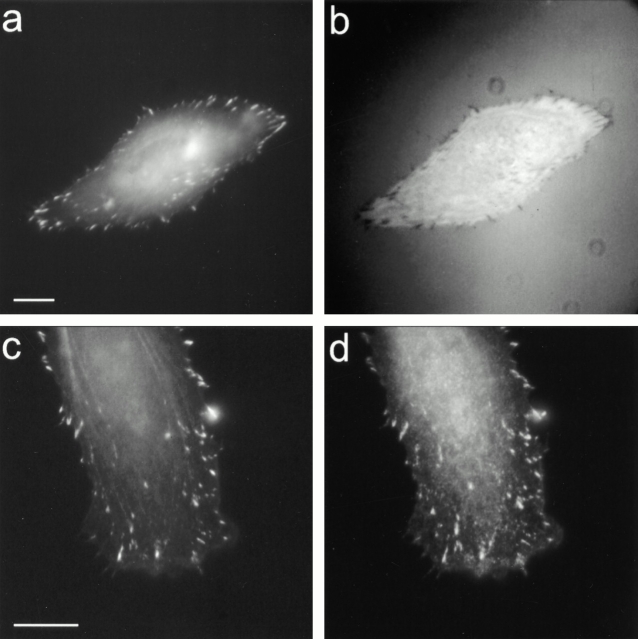
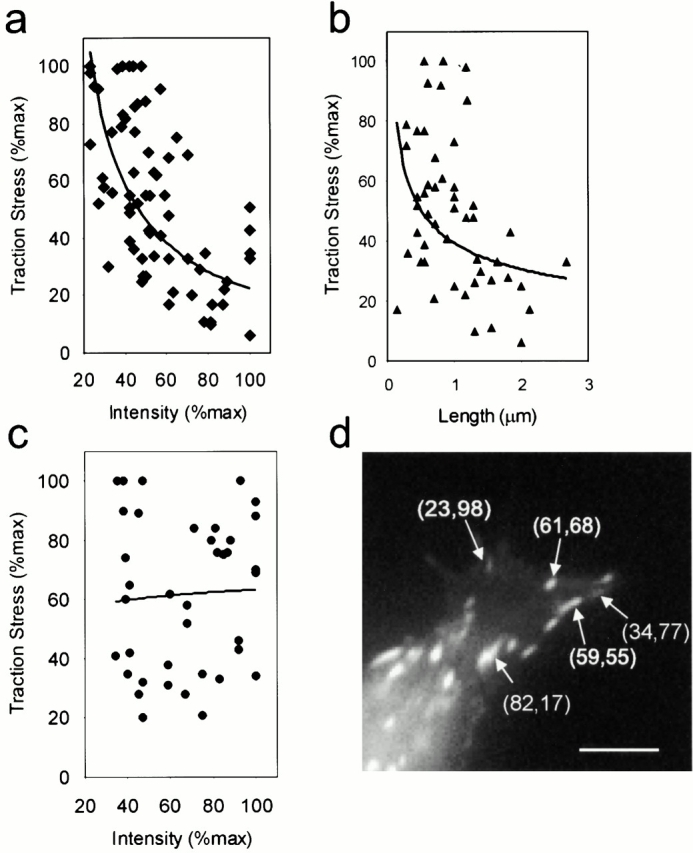
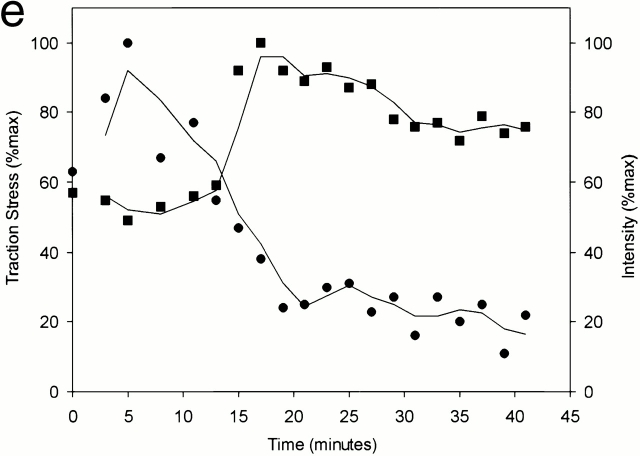
Fibroblast migration involves complex mechanical interactions with the underlying substrate. Although tight substrate contact at focal adhesions has been studied for decades, the role of focal adhesions in force transduction remains unclear. To address this question, we have mapped traction stress generated by fibroblasts expressing green fluorescent protein (GFP)-zyxin. Surprisingly, the overall distribution of focal adhesions only partially resembles the distribution of traction stress. In addition, detailed analysis reveals that the faint, small adhesions near the leading edge transmit strong propulsive tractions, whereas large, bright, mature focal adhesions exert weaker forces. This inverse relationship is unique to the leading edge of motile cells, and is not observed in the trailing edge or in stationary cells. Furthermore, time-lapse analysis indicates that traction forces decrease soon after the appearance of focal adhesions, whereas the size and zyxin concentration increase. As focal adhesions mature, changes in structure, protein content, or phosphorylation may cause the focal adhesion to change its function from the transmission of strong propulsive forces, to a passive anchorage device for maintaining a spread cell morphology.


Figures

Figure 1
Figure 1
Monte Carlo simulation of traction stress analysis. Small patches of traction stress were first assigned at random locations within a square area (a and b). Exact deformation matrix was generated from this map at a finite resolution and density (c). After applying random noise and neighborhood averaging to mimic the resolution limit of the measurements (d), the modified deformation matrix was used to calculate the original traction stress (e and f). A pair of forces separated by ∼4.4 μm appears as a single large patch (arrowheads), whereas a pair separated by ∼8.0 μm is clearly resolved (arrows). Panels b and f show color rendering of the magnitude, with red corresponding to strong traction stress and blue corresponding to weak traction stress. Bars: (a) 4 × 10⁶ dyn/cm2; (b) 20 μm (distance between traction forces); (c) 2 μm (substrate deformation); (e) 2 × 10⁵ dyn/cm2 calculated traction stress.
Figure 3
Figure 3
Differences between the distribution of traction stress and focal adhesions. Distributions of traction stress at 0, 6, and 10 min are shown as either vector maps (a, d, and g), or color images after converting the magnitude into colors (b, e, and h). The corresponding distributions of GFP-zyxin show only a limited correlation with traction stress (c, f, and i). Some focal adhesions contain a low concentration of GFP-zyxin but generate strong forces (open arrow), whereas other focal adhesions show strong GFP-zyxin localization but generate relatively weak forces (filled arrows). Arrow in g, 105 dyn/cm2. Bar, 20 μm.
Figure 2
Figure 2
GFP-zyxin as a marker for focal adhesions. Fish fin fibroblasts transfected with GFP-zyxin were plated on collagen-coated coverslips. IRM (b) shows the localization of GFP-zyxin at both large and small focal adhesions (a). Immunofluorescence staining of paxillin (d) shows a similar colocalization with GFP-zyxin (c) at the leading edge. Bars, 10 μm.
Figure 4
Figure 4
Relationship between the intensity of GFP-zyxin and traction stress. Relationship between the intensity of GFP-zyxin at focal adhesions and the corresponding traction stress is shown as scatter plots in the leading lamella (a) or tail region (c). Each point represents a single focal adhesion and is presented as percentage of the maximum within a given cell. The propulsive traction stress in the leading lamella shows an inverse relationship with the intensity of GFP-zyxin (a), whereas the resistive traction at the tail shows no such relationship (c). The plot was generated with measurements from five cells. The relationship between the long dimension of the focal adhesion plaque and traction stress shows a similar inverse relationship in the leading lamella (b). Panel d shows a high magnification image of GFP-zyxin in a leading lamella, with several focal adhesions labeled with their respective intensity (first number in parenthesis) and traction stress (second number in parenthesis), both represented as percentage of the maximum. The intensity of GFP-zyxin at a focal adhesion (▪) increases after its initial appearance to reach a plateau, whereas the corresponding traction stress (•) shows a brief increase followed by a steady decline (e). Both the fluorescence intensity and traction stress are indicated as percentage of the maximum for that cell. Panel f shows images of this process in a separate cell. Transient traction stress appears at a nascent focal adhesion, which continues to develop as the traction stress decreases to the background level (arrowheads). Some focal adhesions disappear concomitantly with the decrease of traction stress (arrows). The color bar shows the relationship between colors and the magnitude of traction stress in dyn/cm2. Time in minutes is indicated. Bar, 5 μm.
Figure 4
Figure 4
Relationship between the intensity of GFP-zyxin and traction stress. Relationship between the intensity of GFP-zyxin at focal adhesions and the corresponding traction stress is shown as scatter plots in the leading lamella (a) or tail region (c). Each point represents a single focal adhesion and is presented as percentage of the maximum within a given cell. The propulsive traction stress in the leading lamella shows an inverse relationship with the intensity of GFP-zyxin (a), whereas the resistive traction at the tail shows no such relationship (c). The plot was generated with measurements from five cells. The relationship between the long dimension of the focal adhesion plaque and traction stress shows a similar inverse relationship in the leading lamella (b). Panel d shows a high magnification image of GFP-zyxin in a leading lamella, with several focal adhesions labeled with their respective intensity (first number in parenthesis) and traction stress (second number in parenthesis), both represented as percentage of the maximum. The intensity of GFP-zyxin at a focal adhesion (▪) increases after its initial appearance to reach a plateau, whereas the corresponding traction stress (•) shows a brief increase followed by a steady decline (e). Both the fluorescence intensity and traction stress are indicated as percentage of the maximum for that cell. Panel f shows images of this process in a separate cell. Transient traction stress appears at a nascent focal adhesion, which continues to develop as the traction stress decreases to the background level (arrowheads). Some focal adhesions disappear concomitantly with the decrease of traction stress (arrows). The color bar shows the relationship between colors and the magnitude of traction stress in dyn/cm2. Time in minutes is indicated. Bar, 5 μm.
Figure 5
Figure 5
Relationship between focal adhesions and mechanical forces during fibroblast migration. The formation of focal adhesions, accompanied by the generation of a pulse of propulsive forces, drives the forward movement. Cell migration is sustained by repeated formation of nascent focal adhesions, and thus repeated pulses of propulsive forces. Mature focal adhesions play only a passive role in anchoring cells to the substrate.

References

    1. Abercrombie M., Dunn G.A. Adhesions of fibroblasts to substratum during contact inhibition observed by interference reflection microscopy. Exp. Cell Res. 1975;92:57–62. - PubMed
    1. Beckerle M.C. Identification of a new protein localized at sites of cell–substrate adhesion. J. Cell Biol. 1986;103:1679–1687. - PMC - PubMed
    1. Beckerle M.C. Zyxin, zinc fingers at sites of cell adhesions. Bioessays. 1997;19:949–957. - PubMed
    1. Bershadsky A., Chavsovsky A., Becker E., Lyubimova A., Geiger B. Involvement of microtubules in the control of adhesion-dependent signal transduction. Curr. Biol. 1996;6:1279–1289. - PubMed
    1. Bray, D. 2001. Cell Movement: From Molecules to Motility. M. Day, editor. 2nd ed. Garland Publishing, New York. 400 pp.

Publication types