. 2001 May 15;29(10):2135-44.
doi: 10.1093/nar/29.10.2135.

Discovering common stem-loop motifs in unaligned RNA sequences

Affiliations

Discovering common stem-loop motifs in unaligned RNA sequences

J Gorodkin et al. Nucleic Acids Res. .

Abstract

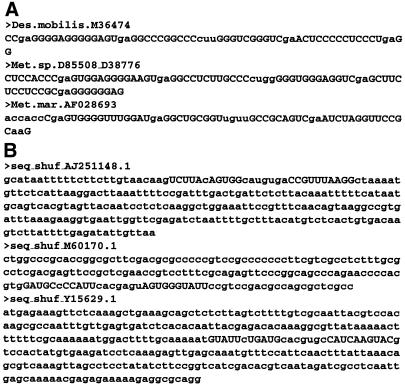
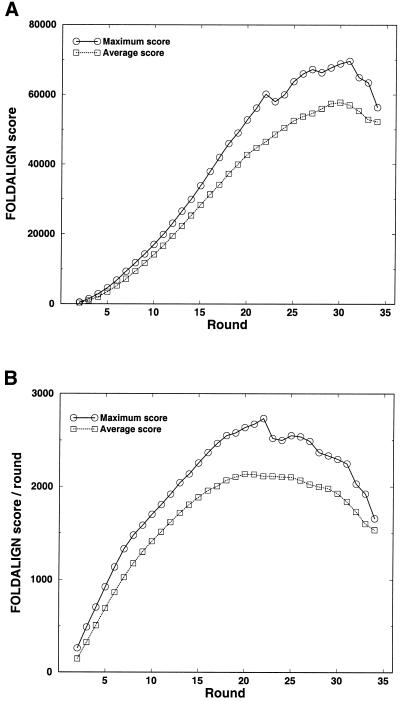
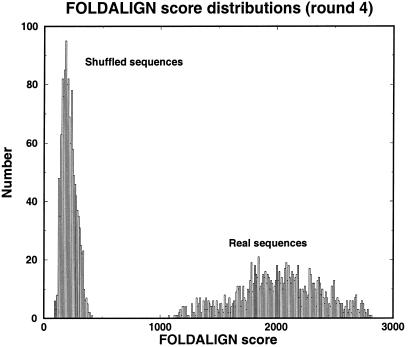
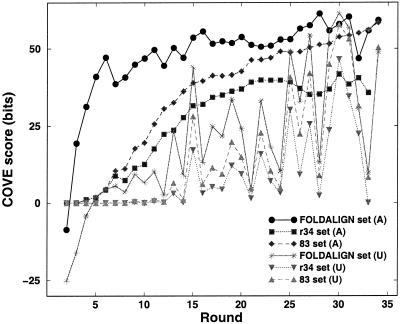
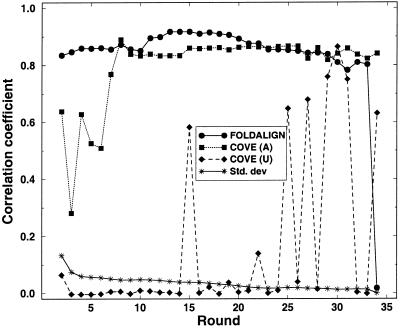
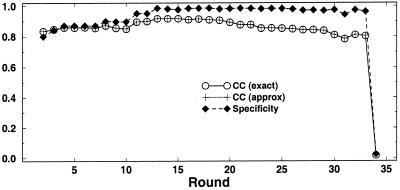
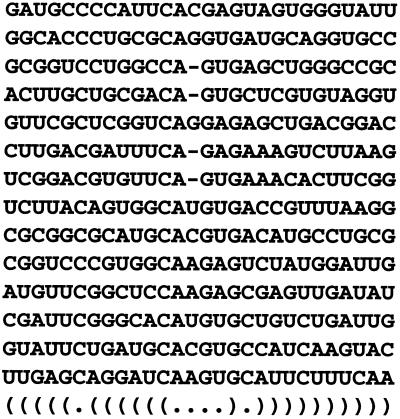
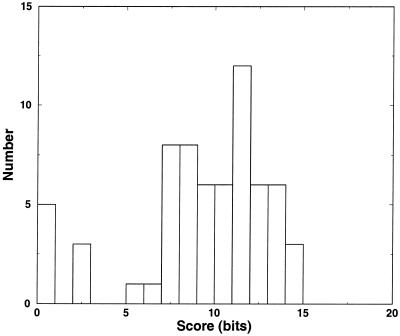
Post-transcriptional regulation of gene expression is often accomplished by proteins binding to specific sequence motifs in mRNA molecules, to affect their translation or stability. The motifs are often composed of a combination of sequence and structural constraints such that the overall structure is preserved even though much of the primary sequence is variable. While several methods exist to discover transcriptional regulatory sites in the DNA sequences of coregulated genes, the RNA motif discovery problem is much more difficult because of covariation in the positions. We describe the combined use of two approaches for RNA structure prediction, FOLDALIGN and COVE, that together can discover and model stem-loop RNA motifs in unaligned sequences, such as UTRs from post-transcriptionally coregulated genes. We evaluate the method on two datasets, one a section of rRNA genes with randomly truncated ends so that a global alignment is not possible, and the other a hyper-variable collection of IRE-like elements that were inserted into randomized UTR sequences. In both cases the combined method identified the motifs correctly, and in the rRNA example we show that it is capable of determining the structure, which includes bulge and internal loops as well as a variable length hairpin loop. Those automated results are quantitatively evaluated and found to agree closely with structures contained in curated databases, with correlation coefficients up to 0.9. A basic server, Stem-Loop Align SearcH (SLASH), which will perform stem-loop searches in unaligned RNA sequences, is available at http://www.bioinf.au.dk/slash/.


Figures

Figure 1
Figure 1
(A) Sequences from the archaeal SSU rRNA that only align locally, and (B) IRE/UTR sequences generated with higher degree of degeneracy. Upper case letters indicate base pair regions (the two outermost uppercase letters base pair, and so on).
Figure 2
Figure 2
Score growth for the locally alignable sequences. For comparison, the average scores of all alignments have been included: (A) raw FOLDALIGN score and (B) round–normalized FOLDALIGN score. At round two, the best score was a factor of 1.5 higher than the average score.
Figure 3
Figure 3
The score distribution for round 4. For comparison, the distribution of a set where the nucleotides were shuffled while preserving the di-nucleotide distribution in the sequences (38). The same distribution was also obtained from a mono-nucleotide shuffling.
Figure 4
Figure 4
COVE performance on the best FOLDALIGN alignment for increasing rounds. Covariance models were made using the FOLDALIGN alignment, or the corresponding sequences without the alignment. For each such case we report the average performance on the sequences themselves, the average performance on the remaining sequences in the r34 set, and on the remaining 83 of the total 117 sequences in the dataset.
Figure 5
Figure 5
The correlation coefficients for each round comparing the database alignment to FOLDALIGN, COVE (A) and COVE (U). The standard deviations of FOLDALIGN scores have been included to indicate the descent of low score alignment that have high correlation coefficient, for increasing rounds.
Figure 6
Figure 6
The accurate calculation of Matthews correlation coefficient, compared to the geometric mean approximation. For comparison, the specificity is shown. An example for FOLDALIGN on locally alignable sequences is shown. As FOLDALIGN requires all sequences to base pair to assign common base pair, and the structure for each sequence in general can have more base pairs than consensus, the false negative rate should be expected to be higher than the false positive rate. Thus, the specificity is higher than the sensitivity (data not shown).
Figure 7
Figure 7
The local alignment found by FOLDALIGN. The motifs were distributed randomly in UTR-like sequences of length 100–330 nt, as shown in Figure 1. FOLDALIGN located the motifs and aligned them by their structure. The last line indicates the structure assignment, using parentheses to indicate individual base pairs.
Figure 8
Figure 8
Distribution of COVE scores on all 56 sequences when the alignment shown in Figure 7 was used as a core alignment. The distribution suggest a natural score cut-off to discard false hits.

References

    1. Pabo C.O. and Nekludova,L. (2000) Geometric analysis and comparison of protein–DNA interfaces: why is there no simple code for recognition? J. Mol. Biol., 301, 597–624. - PubMed
    1. Gygi S.P., Rochon,Y., Franza,B.R. and Aebersold,R. (1999) Correlation between protein and mRNA abundance in yeast. Mol. Cell. Biol., 19, 1720–1730. - PMC - PubMed
    1. Gray N.K. and Hentze,M.W. (1994) Regulation of protein synthesis by mRNA structure. Mol. Biol. Rep., 19, 195–200. - PubMed
    1. Klaff P., Riesner,D. and Steger,G. (1996) RNA structure and the regulation of gene expression. Plant Mol. Biol., 32, 89–106. - PubMed
    1. Stormo G.D. and Hartzell,G.W.,III (1989) Identifying protein-binding sites from unaliged DNA fragments. Proc. Natl Acad. Sci. USA, 86, 1183–1187. - PMC - PubMed

Publication types

MeSH terms