

Pharmacokinetic-pharmacodynamic modeling of the electroencephalogram effect of imipenem in healthy rats
- PMID: 11353611
- PMCID: PMC90531
- DOI: 10.1128/AAC.45.6.1682-1687.2001
Pharmacokinetic-pharmacodynamic modeling of the electroencephalogram effect of imipenem in healthy rats
Abstract
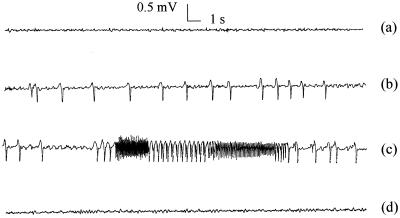
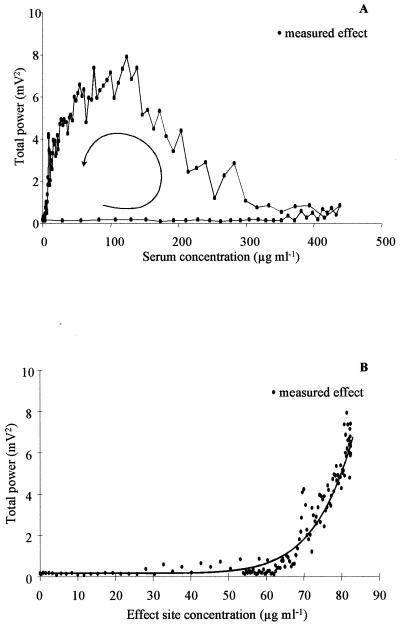
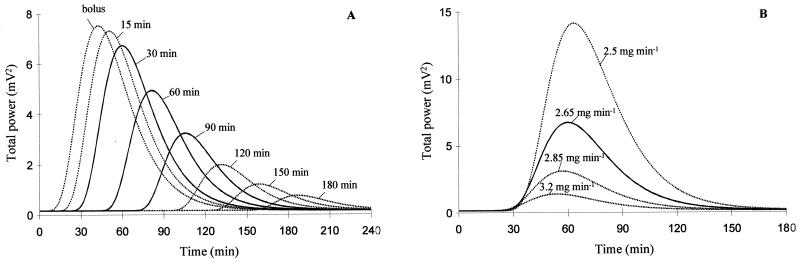
A pharmacokinetic-pharmacodynamic (PK-PD) modeling approach was developed to investigate the epileptogenic activity of imipenem in rats. Initially, animals received an intravenous infusion of imipenem at a rate of 2.65 mg min(-1) for 30 min. Blood samples were collected for drug assay, and an electroencephalogram (EEG) was recorded during infusion and postinfusion. A dramatic delay was observed between concentrations of imipenem in serum and the EEG effect; this effect was accompanied by tremors and partial seizures. Indirect-effect models failed to describe these data, which were successfully fitted using an effect compartment model. The relationship between effect and concentration at the effect site was best described by a spline function. The elimination rate constant from the effect compartment was severalfold lower than that from the central compartment. The robustness of the model was then confirmed after administering the imipenem dose over 60 and 90 min. In conclusion, the successful PK-PD modeling of the imipenem EEG effect in rats constitutes a major improvement for better prediction of the epileptogenic risk associated with this antibiotic.
Figures


Similar articles
-
Pharmacokinetic-pharmacodynamic modeling of the electroencephalogram effect of norfloxacin in rats.Antimicrob Agents Chemother. 2003 Jun;47(6):1952-7. doi: 10.1128/AAC.47.6.1952-1957.2003. Antimicrob Agents Chemother. 2003. PMID: 12760873 Free PMC article.
-
Pharmacokinetic-pharmacodynamic modeling of electroencephalogram effect of imipenem in rats with acute renal failure.Antimicrob Agents Chemother. 2001 Dec;45(12):3607-9. doi: 10.1128/AAC.45.12.3607-3609.2001. Antimicrob Agents Chemother. 2001. PMID: 11709350 Free PMC article.
-
Pharmacokinetic-pharmacodynamic modelling of the electroencephalogram effect of imipenem in rats with experimental hypovolaemia or endotoxaemia.J Antimicrob Chemother. 2004 Jul;54(1):187-92. doi: 10.1093/jac/dkh255. Epub 2004 May 26. J Antimicrob Chemother. 2004. PMID: 15163649
-
Electroencephalogram-based pharmacodynamic measures: a review.Int J Clin Pharmacol Ther. 2012 Mar;50(3):162-84. doi: 10.5414/cp201484. Int J Clin Pharmacol Ther. 2012. PMID: 22373830 Free PMC article. Review.
-
Pharmacodynamic modeling of anesthetic EEG drug effects.Annu Rev Pharmacol Toxicol. 1992;32:423-47. doi: 10.1146/annurev.pa.32.040192.002231. Annu Rev Pharmacol Toxicol. 1992. PMID: 1605573 Review. No abstract available.
Cited by
-
Simultaneous central nervous system distribution and pharmacokinetic-pharmacodynamic modelling of the electroencephalogram effect of norfloxacin administered at a convulsant dose in rats.Br J Pharmacol. 2004 May;142(2):323-30. doi: 10.1038/sj.bjp.0705748. Br J Pharmacol. 2004. PMID: 15155539 Free PMC article.
-
Pharmacokinetic-pharmacodynamic modeling of the electroencephalogram effect of norfloxacin in rats.Antimicrob Agents Chemother. 2003 Jun;47(6):1952-7. doi: 10.1128/AAC.47.6.1952-1957.2003. Antimicrob Agents Chemother. 2003. PMID: 12760873 Free PMC article.
-
Lack of effect of experimental hypovolemia on imipenem muscle distribution in rats assessed by microdialysis.Antimicrob Agents Chemother. 2005 Dec;49(12):4974-9. doi: 10.1128/AAC.49.12.4974-4979.2005. Antimicrob Agents Chemother. 2005. PMID: 16304160 Free PMC article.
-
Microdialysis study of imipenem distribution in skeletal muscle and lung extracellular fluids of noninfected rats.Antimicrob Agents Chemother. 2005 Jun;49(6):2356-61. doi: 10.1128/AAC.49.6.2356-2361.2005. Antimicrob Agents Chemother. 2005. PMID: 15917533 Free PMC article.
-
Pharmacokinetic-pharmacodynamic modeling of electroencephalogram effect of imipenem in rats with acute renal failure.Antimicrob Agents Chemother. 2001 Dec;45(12):3607-9. doi: 10.1128/AAC.45.12.3607-3609.2001. Antimicrob Agents Chemother. 2001. PMID: 11709350 Free PMC article.
References
-
- Calandra G B, Brown K R, Grad L C, Ahonkkai V I, Wang C, Aziz M A. Review of adverse experiences and tolerability in the first 2,516 patients treated with imipenem/cilastatin. Am J Med. 1985;78(Suppl. 6A):73–78. - PubMed
-
- Calandra G B, Lydick E, Carrigan J, Weiss L, Guess H. Factors predisposing to seizures in seriously ill infected patients receiving antibiotics: experience with imipenem/cilastatin. Am J Med. 1988;84:911–918. - PubMed
-
- Calandra G B, Wang C, Aziz M A, Brown K R. The safety profile of imipenem/cilasatin: worldwide clinical experience based on 3470 patients. J Antimicrob Chemother. 1986;18(Suppl. E.):193–202. - PubMed
-
- Carlucci G, Biordi L, Vicentini C, Bologna M. Determination of imipenem in human plasma, urine and tissue by high-performance liquid chromatography. J Pharm Biomed Anal. 1990;8:283–286. - PubMed
-
- Christ W. Central nervous system toxicity of quinolones: human and animal findings. J Antimicrob Chemother. 1990;26(Suppl. B):219–225. - PubMed
MeSH terms
Substances
LinkOut - more resources
Full Text Sources
Miscellaneous
