. 2001 May 22;98(11):5997-6002.
doi: 10.1073/pnas.101126198. Epub 2001 May 15.

Agonist-induced conformational changes in the G-protein-coupling domain of the beta 2 adrenergic receptor

Affiliations

Agonist-induced conformational changes in the G-protein-coupling domain of the beta 2 adrenergic receptor

P Ghanouni et al. Proc Natl Acad Sci U S A. .

Abstract

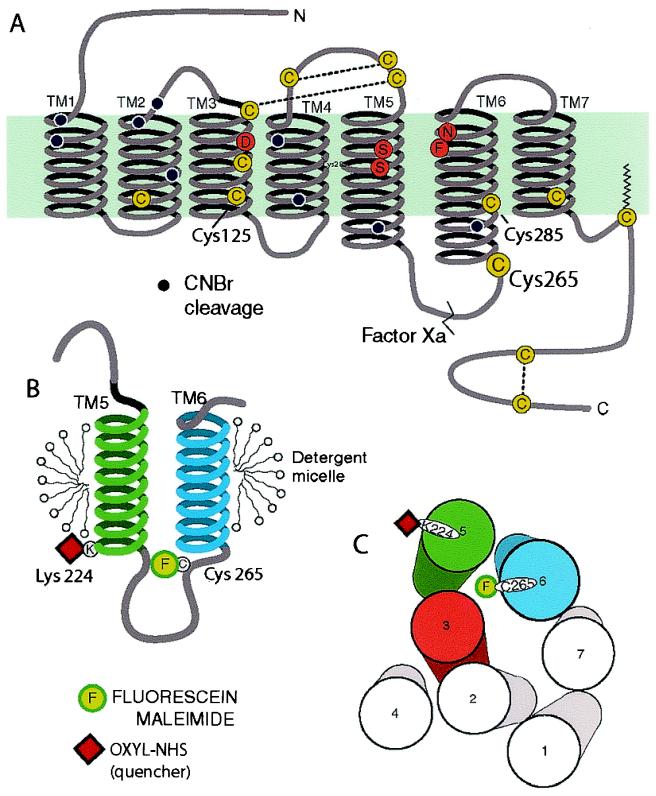
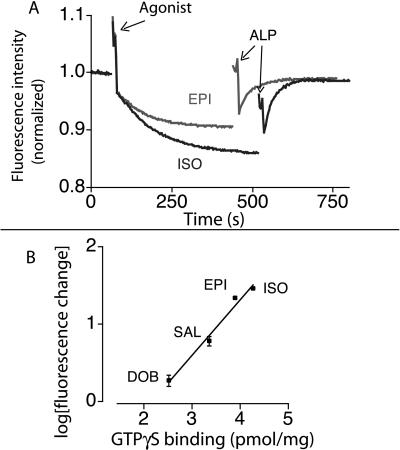
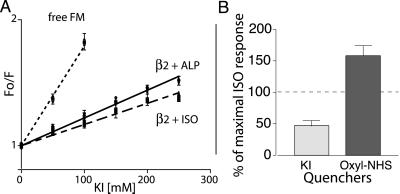
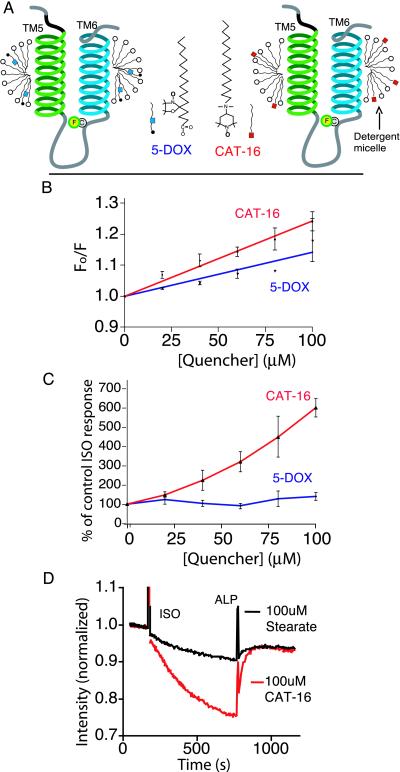
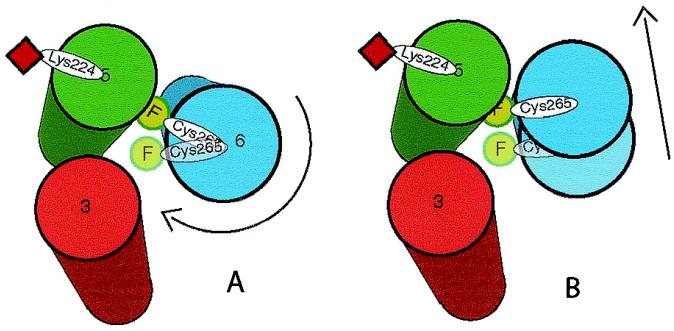
The majority of extracellular physiologic signaling molecules act by stimulating GTP-binding protein (G-protein)-coupled receptors (GPCRs). To monitor directly the formation of the active state of a prototypical GPCR, we devised a method to site specifically attach fluorescein to an endogenous cysteine (Cys-265) at the cytoplasmic end of transmembrane 6 (TM6) of the beta(2) adrenergic receptor (beta(2)AR), adjacent to the G-protein-coupling domain. We demonstrate that this tag reports agonist-induced conformational changes in the receptor, with agonists causing a decline in the fluorescence intensity of fluorescein-beta(2)AR that is proportional to the biological efficacy of the agonist. We also find that agonists alter the interaction between the fluorescein at Cys-265 and fluorescence-quenching reagents localized to different molecular environments of the receptor. These observations are consistent with a rotation and/or tilting of TM6 on agonist activation. Our studies, when compared with studies of activation in rhodopsin, indicate a general mechanism for GPCR activation; however, a notable difference is the relatively slow kinetics of the conformational changes in the beta(2)AR, which may reflect the different energetics of activation by diffusible ligands.


Figures

Figure 1
Figure 1
Schematic diagram of the secondary structure of the β2AR illustrating the FM-labeling site at Cys-265. (A) There are 13 cysteines (yellow circles) in the β2AR, yet only Cys-265 is labeled with the relatively large polar fluorophore FM under the conditions described in Materials and Methods. Cys-106, Cys-184, Cys-190, and Cys-191 have been shown to be disulfide bonded (38, 39), and Cys-341 is palmitoylated (40). Cys-378 and Cys-406 in the carboxyl terminus form a disulfide bond during purification (data not shown). Labeling specificity was confirmed by peptide mapping and mutagenesis of potential reactive cysteines (data not shown). The sites of peptide cleavage by Factor Xa (line) and cyanogen bromide (black dots) are shown. (B) Schematic focusing on TM helices 5 and 6 and the connecting intracellular loop 3 (IC3). The location of the FM (F) site is highlighted. Fluorescence quenchers localized to either the aqueous milieu, the micellar environment, or the base of TM5 (oxyl-NHS bound to Lys-224, red square) were used to monitor conformational changes around Cys-265. (C) Cylinders representing the seven TM helices of the β2AR as viewed from the cytoplasmic side of the membrane, arranged according to the crystal structure of rhodopsin in the inactive state. In the inactive receptor, FM on Cys-265, is predicted to point toward the cytoplasmic extensions of TMs 3, 5, and 6. Also shown is the predicted position of the quencher oxyl-NHS on Lys-224 (red square).
Figure 2
Figure 2
Effect of agonists and partial agonists on fluorescence intensity of FM-β2AR. (A) The change in intensity of FM-β2AR in response to the addition of the full agonist ISO and the strong partial agonist epinephrine was reversed by the neutral antagonist ALP. In most experiments, we use the ALP reversal to quantitate the magnitude of the agonist-induced change. We found the ALP reversal to be the most consistent measure for comparison of agonist-induced conformational changes, because ALP reversal occurs over a shorter period relative to agonist responses and therefore is less subject to nonspecific effects on fluorescence intensity (e.g., photobleaching, receptor denaturation) that affect the baseline. ALP alone did not induce any changes in fluorescence, and treatment with ligands did not cause a change in the wavelength of maximum emission (data not shown). (B) Agonist and partial agonist effects on the intensity of FM-β2AR are compared with an assay of biological efficacy (GTPγS binding). FM-β2AR was treated with different agonists, and the change in fluorescence was measured at a time equal to 5 times the calculated t1/2 for each drug. All agonists were used at 100 μM to ensure saturation of the receptors and eliminate the effect of variations in agonist affinities. The ability of these ligands to stimulate GTPγS binding in a β2AR-Gαs fusion protein was determined, as previously described (41). All data represent experiments performed in triplicate.
Figure 3
Figure 3
Response of FM-β2R to agonist in the presence of KI or oxyl-NHS. (A) Stern–Volmer plots of KI quenching of FM-labeled β2AR. KI was added to FM reacted with cysteine, to labeled receptor incubated with 20 μM ALP, and to labeled receptor incubated with 100 μM ISO. Fluorescence was measured and plotted as described in Materials and Methods. The quenching constant Ksv was 7.9 ± 0.4 M−1 for fluorescein alone, 2.19 ± 0.06 M−1 for labeled receptor incubated with ALP, and 1.66 ± 0.06 M−1 for labeled receptor incubated with ISO. The difference between ISO and ALP was significant (P < 0.05, unpaired t test). There was no difference in Ksv between buffer alone and ALP treatments. All values are mean ± SEM, n = 3. (B) The effect of quenchers KI and oxyl-NHS on the magnitude of the ISO-induced decrease in fluorescence was determined. Percentage of control ISO response was calculated by using the formula [100 (ISO induced change in fluorescence in the presence of quencher)/(ISO induced change in fluorescence in the absence of quencher)]. For the aqueous quencher KI, the ISO-induced change in fluorescence in the presence of 250 mM KI was less than that in the presence of 250 mM KCl (55.4 ± 8.3% of control ISO response). In contrast, covalent binding of the spin-labeled quencher oxyl-NHS to K224 in TM5 increased the magnitude of the ISO response relative to the control (158 ± 8% control ISO response). In these experiments, the magnitude of the ALP reversal of the ISO-induced change in fluorescence was used as a measure of the magnitude of the ISO response for reasons given in the legend for Fig. 2. All values are mean ± SEM, n = 3.
Figure 4
Figure 4
Comparison of effects of quenchers localized to the micelle on the response of FM-β2R to ISO. (A) Schematic depicting the structure of CAT-16 and 5-DOX, as well as the putative location of these quenching groups in the micelle. The quenching group on CAT-16 is localized on the polar surface of the micelle. The quenching group on 5-DOX is located within the hydrophobic core of the micelle. (B) Stern–Volmer plots depicting the extent of quenching of FM-β2AR by increasing concentrations of CAT-16 or 5-DOX. Quenchers were added to labeled receptor, and fluorescence was measured and plotted as in Fig. 3 and Materials and Methods. The total lipid concentration was kept constant at 100 μM with stearic acid. The quenching constant Ksv was 2.4 ± 0.1 mM−1 in the presence of CAT-16 and 1.4 ± 0.2 mM−1 in the presence of 5-DOX. (C) Differing effects of CAT-16 and 5-DOX on agonist-induced fluorescence change of FM-β2AR. The extent of response to ISO is presented as a percentage of control ISO response, calculated as in Fig. 3. (D) An example of the experiments used to generate the ratios in C. In this example, FM-β2AR was incubated with either 100 μM CAT-16 or 100 μM stearic acid. The response to agonist was monitored as described in Fig. 2. In the presence of the quencher CAT-16, ISO induced a 24.2 ± 0.3% decrease in fluorescence vs. 4.1 ± 0.6% in the presence of the stearic acid. All values are mean ± SEM, n = 3.
Figure 5
Figure 5
A schematic indicating agonist-induced conformational changes in around Cys-265. The model represents TM domains 3, 5, and 6, as viewed from the cytoplasmic surface of the receptor, arranged according to the crystal structure of rhodopsin. In the inactive receptor, FM (green circle) on Cys-265 is predicted to point toward the cytoplasmic extensions of TMs 3, 5, and 6. Also shown is the predicted position of the quencher oxyl-NHS on Lys-224 (red square). The results from quenching experiments can best be explained by either a clockwise rotation of TM6 (A) and/or a tilting of TM6 (B) toward TM5 during agonist-induced activation of the receptor, as described in the text.

References

    1. Strader C D, Fong T M, Tota M R, Underwood D, Dixon R A. Annu Rev Biochem. 1994;63:101–132. - PubMed
    1. Ji T H, Grossmann M, Ji I. J Biol Chem. 1998;273:17299–17302. - PubMed
    1. Kobilka B. Annu Rev Neurosci. 1992;15:87–114. - PubMed
    1. Gether U. Endocr Rev. 2000;21:90–113. , in press. - PubMed
    1. Palczewski K, Kumasaka T, Hori T, Behnke C A, Motoshima H, Fox B A, Le Trong I, Teller D C, Okada T, Stenkamp R E, et al. Science. 2000;289:739–745. - PubMed

Publication types

MeSH terms