. 2001 Jun 1;21(11):3729-39.
doi: 10.1523/JNEUROSCI.21-11-03729.2001.

Membrane resonance and subthreshold membrane oscillations in mesencephalic V neurons: participants in burst generation

Affiliations

Membrane resonance and subthreshold membrane oscillations in mesencephalic V neurons: participants in burst generation

N Wu et al. J Neurosci. .

Abstract

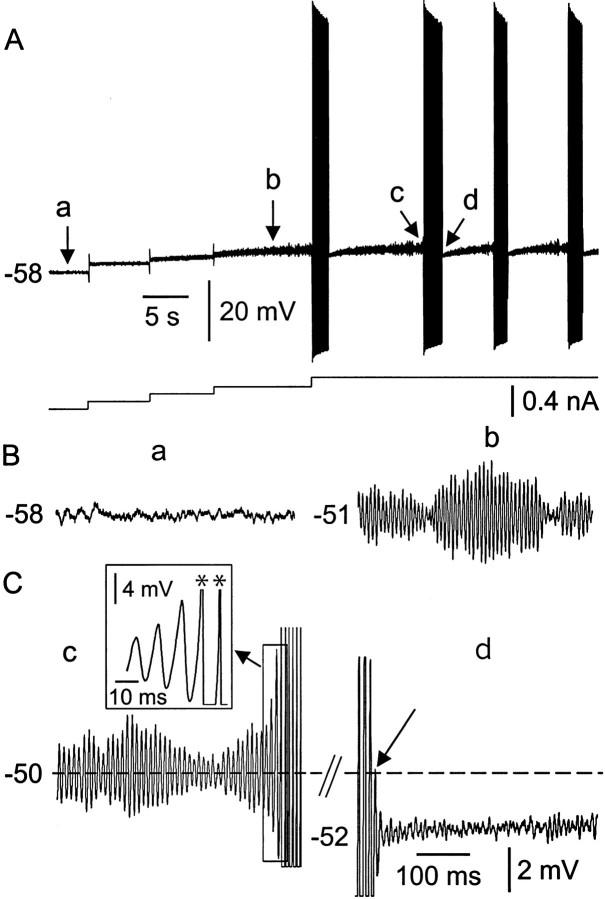
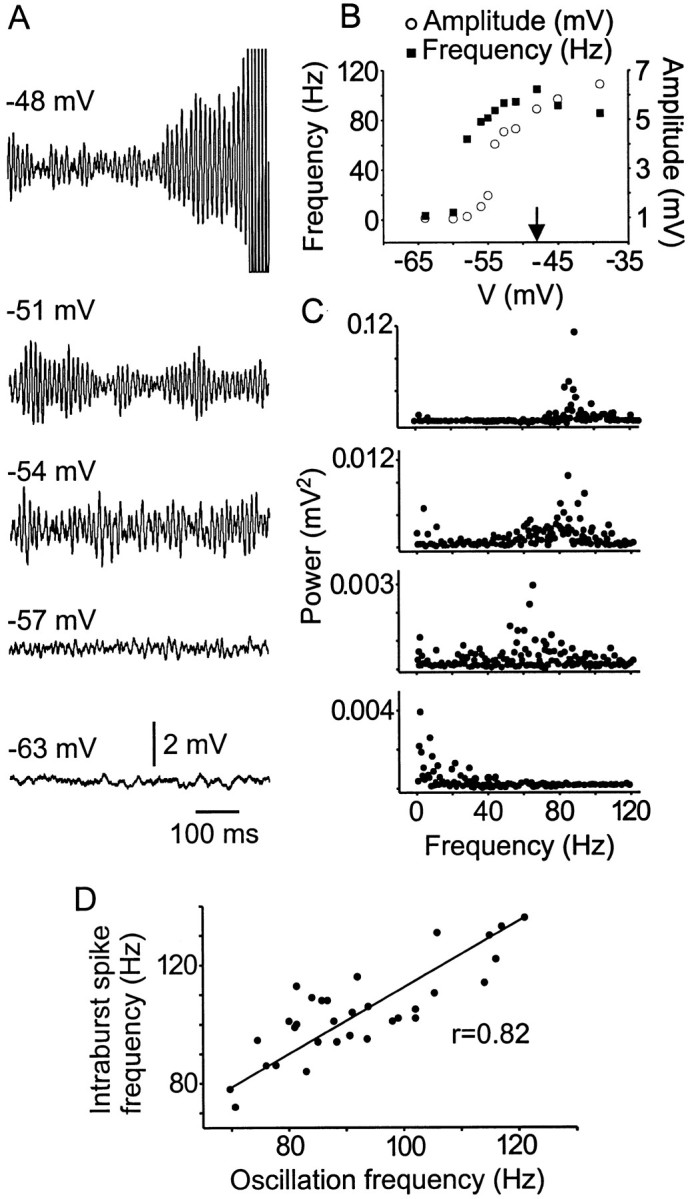
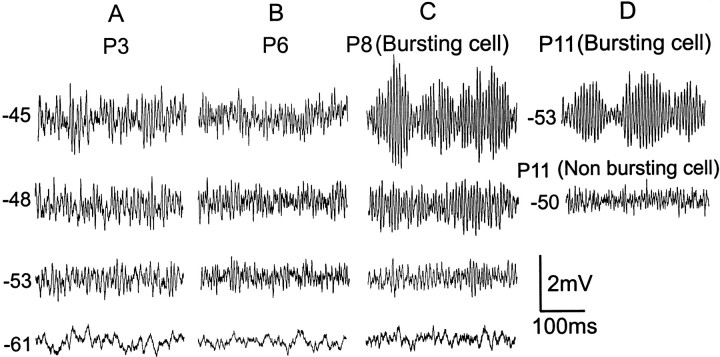
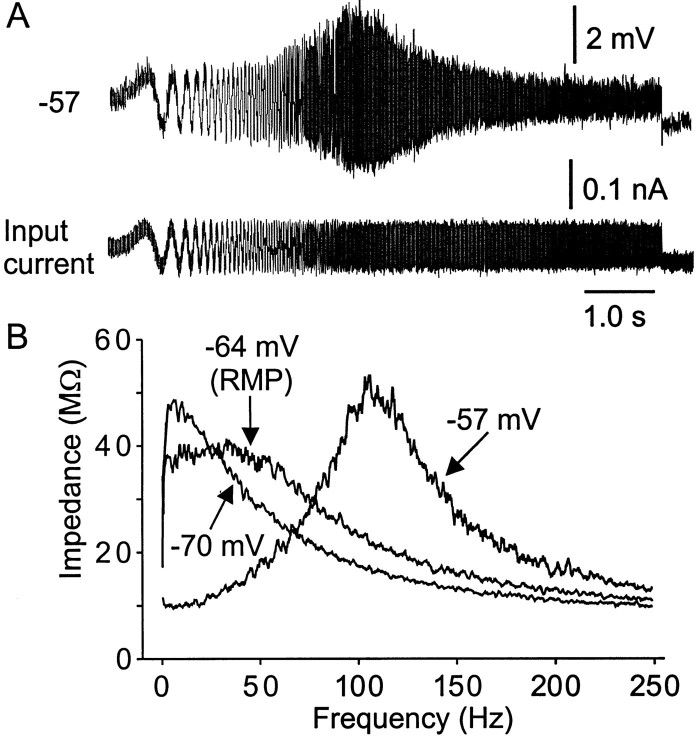
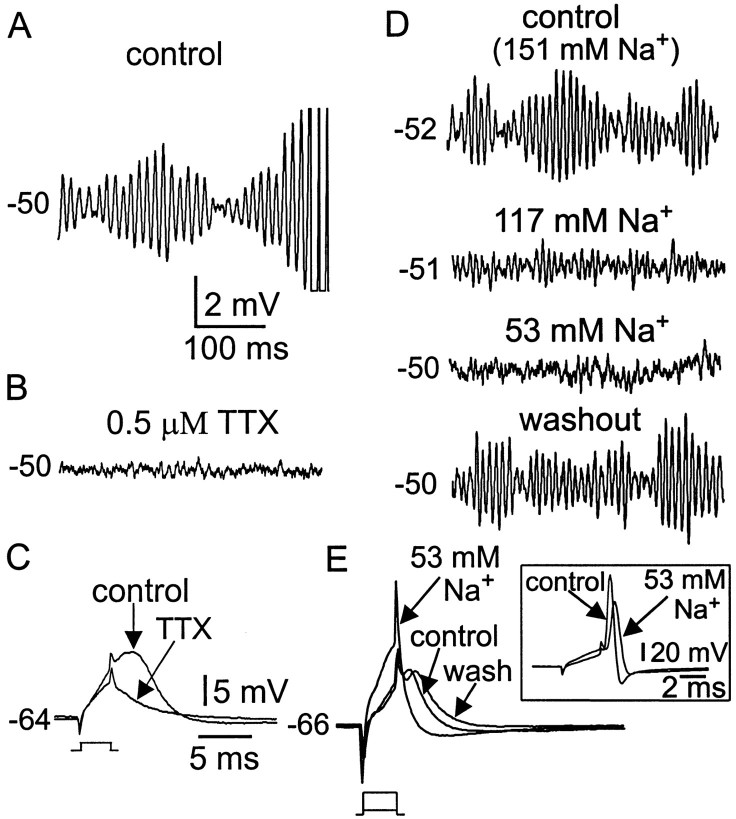
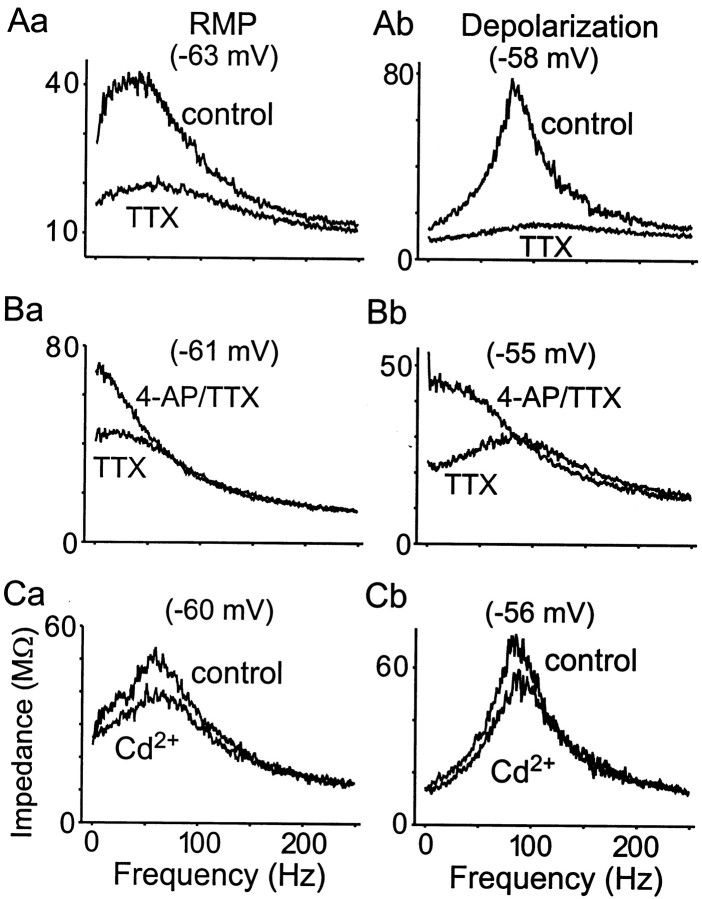
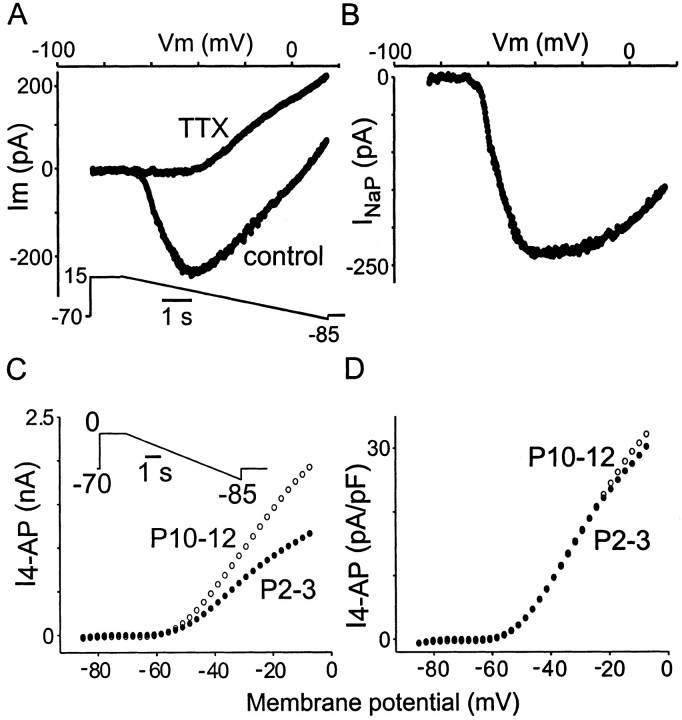
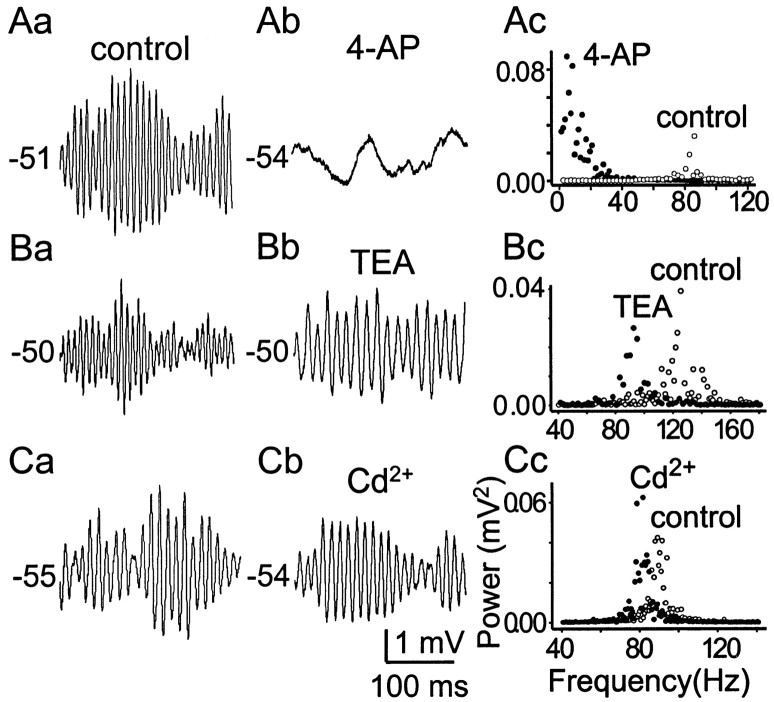
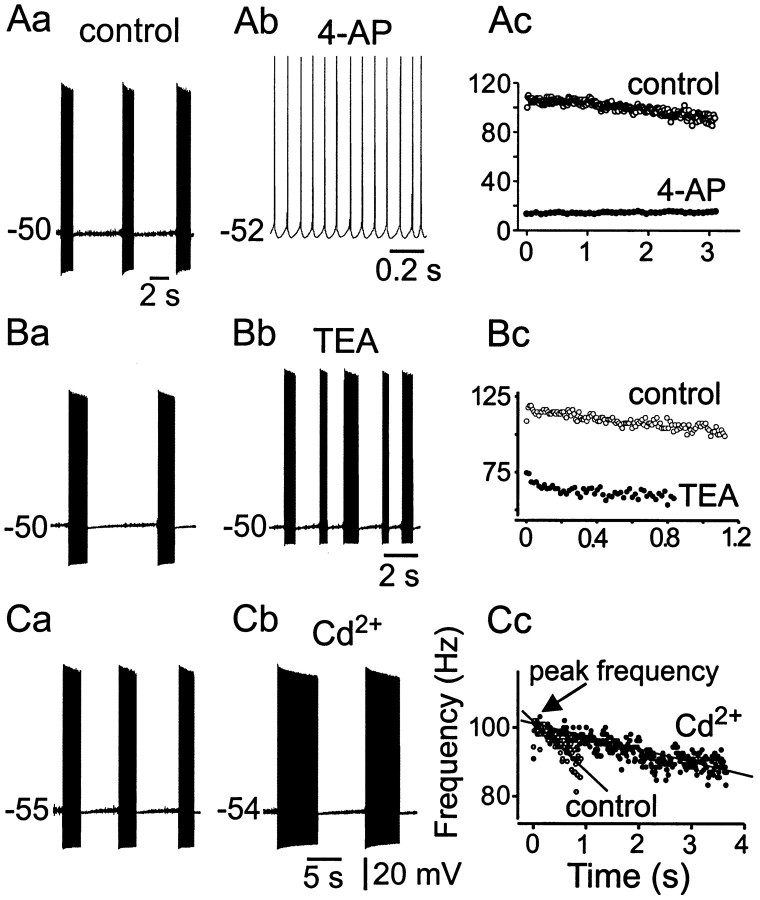
Trigeminal mesencephalic (Mes V) neurons are critical components of the circuits controlling oral-motor activity. The possibility that they can function as interneurons necessitates a detailed understanding of the factors controlling their soma excitability. Using whole-cell patch-clamp recording, in vitro, we investigated the development of the ionic mechanisms responsible for the previously described subthreshold membrane oscillations and rhythmical burst discharge in Mes V neurons from rats ages postnatal day (P) 2-12. We found that the oscillation amplitude and frequency increased during development, whereas bursting emerged after P6. Furthermore, when bursting was initiated, the spike frequency was largely determined by the oscillation frequency. Frequency domain analysis indicated that these oscillations emerged from the voltage-dependent resonant properties of Mes V neurons. Low doses of 4-aminopyridine (<100 microm) reduced the oscillations and abolished resonance in most neurons, suggesting that the resonant current is a steady-state K(+) current (I(4-AP)). Sodium ion replacement or TTX reduced substantially the oscillations and peak amplitude of the resonance, suggesting the presence of a persistent Na(+) current (I(NaP)) that functions to amplify the resonance and facilitate the emergence of subthreshold oscillations and bursting.


Figures

Fig. 1.
Fig. 1.
Subthreshold oscillations and spontaneous burst discharges are evoked by membrane depolarization. A, Membrane potential response to different levels of maintained current injection. When depolarized by adding constant current stimuli, subthreshold oscillations emerged and developed into spontaneous burst discharges after further depolarization. Bottom trace is current stimuli. B, C, High gain records of segments of membrane potential taken from A and indicated by lowercase letters. Ba, At resting membrane potential of −58 mV, prominent oscillations were not evident. Bb, Membrane depolarization produced subthreshold oscillations with a dominant frequency of ∼90 Hz and a peak-to-peak amplitude of 4.3 mV. Cc, Initiation of spikes from the peak of subthreshold membrane oscillations. Spikes are truncated. Inset taken from region of boxat a faster time base. Asterisks indicate spikes.Cd, Termination of burst discharge. Note the aborted oscillations and suppression of oscillations during the early part of the hyperpolarization after burst. The data were recorded from a P12 animal. Calibration in C applies toB.
Fig. 2.
Fig. 2.
The amplitude and frequency of subthreshold oscillations are voltage dependent. A, Subthreshold oscillations were elicited by maintained membrane depolarization. Spikes are truncated. B, Plot of subthreshold oscillation frequency and amplitude versus membrane holding potential.Arrow indicates the membrane potential level where bursts were initiated and maintained. C, FFT analysis was performed at the same voltage levels indicated in A. Note the shift in frequency and power with increases in membrane potential. All data came from the same cell. D, Correlation between intraburst spike frequency and subthreshold oscillation frequency. Data are from 32 neurons.
Fig. 3.
Fig. 3.
Subthreshold membrane oscillations are developmentally regulated. A, B, In P3 and P6 animals, membrane depolarization did not evoke distinct, maintained subthreshold oscillations or rhythmical burst discharge.C, Subthreshold oscillations were evoked in approximately half of the P8 animals by membrane depolarization. Bursting was always accompanied by subthreshold oscillations.D, Membrane potential traces taken from P11 bursting and nonbursting neurons recorded in the same slice. Note the lack of prominent subthreshold oscillations in the nonbursting neuron.
Fig. 4.
Fig. 4.
The response to ZAP input is voltage dependent.A, Subthreshold swept-sine wave (ZAP) input current (bottom) and corresponding voltage responses (top) recorded in a P11 neuron. Note that the amplitude of membrane potential response to ZAP input increased within a narrow frequency window (resonant frequency) and resulted in a spindle-shaped voltage response. B, Impedance–frequency plot in response to ZAP input at different membrane potentials. Resonance appeared as a hump in the FRC. The peak resonant frequencies andQ values were voltage dependent. The lines were obtained by five points moving average of the data. Note that two different resonant behaviors are observed in Mes V neurons: one is induced by depolarization (−57 mV) with high peak frequency (110 Hz in this neuron), and another is evoked by hyperpolarization from resting potential (−70 mV) with low peak frequency (<10 Hz).
Fig. 5.
Fig. 5.
Subthreshold oscillations and burst discharge depend on TTX-sensitive Na+ current.A, B, Subthreshold membrane potential oscillations and burst discharge (spikes truncated) recorded before (A) and after (B) TTX from a P9 neuron. Note the complete suppression of subthreshold oscillations. C, Subthreshold active membrane response evoked by a short-duration step pulse (0.2 nA, 3 msec) before and after TTX. D, Effects of reducing external sodium concentration on subthreshold membrane oscillations. E, Effects of low sodium concentrations on subthreshold active membrane potential responses. In low sodium conditions, subthreshold active membrane responses were not evoked, even with a larger current pulse (0.8 nA). Inset shows action potentials in low sodium conditions. AC andDE from two different neurons. Calibration in A applies to A,B, and D.
Fig. 6.
Fig. 6.
Resonance is dependent onI4-AP and amplified byINaP. AC, Impedance–frequency relationships in response to different channel antagonists at two levels of membrane potential. Aa,Ab, Application of 0.2 μm TTX reduced the impedance magnitude of FRC substantially at both resting membrane potential and depolarized potentials but did not abolish it.Ba, Bb, Effects of 4-AP (10 μm) were recorded in the presence of 0.2 μmTTX to suppress spikes. 4-AP abolished resonant behavior at both voltage levels and decreased the Q values to 1, indicating that the membrane acted as a low-pass filter.Ca, Cb, Application of 100 μm Cd2+ produced modest effects on resonance.
Fig. 7.
Fig. 7.
Isolation of INaP andI4-AP in Mes V neurons. A,IV relationship in the absence and presence of TTX. Protocol is indicated. Application of 1 μm TTX blocked the persistent inward current, leaving an outward current. B, INaP was obtained by digital subtraction of the curves inA (controlTTX). In this neuron,INaP activated at −69 mV and reached its peak around −40 mV. C, MeanIV relationship forI4-AP in P2–3 and P10–12 neurons. Protocol is indicated. The 4-AP-sensitive current was obtained by digital subtraction of 4-AP traces from control. In both P2–3 and P10–12 animals, 4-AP-sensitive currents activated around −60 mV, but the absolute magnitude of the current was larger in the older compared with the young group. D, MeanIV relationship forI4-AP after the current was normalized for cell capacitance. Note the complete overlap of current except at the highest command potentials. Leak subtraction was performed off-line. Data are based on 23 P2–3 and 21 P10–12 neurons and were plotted at discrete voltages from ramp data. Error bars are omitted for clarity.
Fig. 8.
Fig. 8.
I4-AP is critical for the production of high-frequency subthreshold membrane oscillations.Aa, Ab, 4-AP (10 μm) transformed the high-frequency subthreshold oscillations into low-frequency oscillations. Ac, FFT analysis showed the dominant frequency of subthreshold oscillation shifted from ∼90 to ∼10 Hz after 4-AP application. Ba, Bb, Effects of 10 mm TEA on subthreshold oscillations. Compared with 4-AP, TEA effects were modest. C, Cd2+ (100 μm) had minimal effects on both frequency and amplitude of subthreshold oscillations.
Fig. 9.
Fig. 9.
Effects of antagonists on bursting and spike discharge characteristics. I4-AP is important for rhythmical burst discharge. Aa,Ab, 4-AP (50 μm) transformed the rhythmical burst discharge into low-frequency tonic spiking. Note the reduction in fast AHP after 4-AP. Ac, Instantaneous spike frequency–time relationship. Note the reduction in frequency and absence of adaptation after 4-AP. B, Effects of 10 mm TEA on burst characteristics. C, Cd2+ (100 μm) significantly prolonged the burst duration and cycle burst duration without affecting peak intraburst frequency and fast AHP.

Similar articles

Cited by

References

    1. Alley KE. Quantitative analysis of the synaptogenic period in the trigeminal mesencephalic nucleus. Anat Rec. 1973;177:49–59. - PubMed
    1. Alzheimer C. A novel voltage-dependent cation current in rat neocortical neurones. J Physiol (Lond) 1994;479:199–205. - PMC - PubMed
    1. Amir R, Michaelis M, Devor M. Membrane potential oscillations in dorsal root ganglion neurons: role in normal electrogenesis and neuropathic pain. J Neurosci. 1999;19:8589–8596. - PMC - PubMed
    1. Baker R, Llinas R. Electrotonic coupling between neurones in the rat mesencephalic nucleus. J Physiol (Lond) 1971;212:45–63. - PMC - PubMed
    1. Buisseret-Delmas C, Pinganaud G, Compoint C, Buisseret P. Projection from trigeminal nuclei to neurons of the mesencephalic trigeminal nucleus in rat. Neurosci Lett. 1997;229:189–192. - PubMed

Publication types

MeSH terms