Comparative Study
. 2001 Jun 1;21(11):3968-85.
doi: 10.1523/JNEUROSCI.21-11-03968.2001.

Differential sensorimotor processing of vestibulo-ocular signals during rotation and translation

Affiliations
Comparative Study

Differential sensorimotor processing of vestibulo-ocular signals during rotation and translation

D E Angelaki et al. J Neurosci. .

Abstract

Rotational and translational vestibulo-ocular reflexes (RVOR and TrVOR) function to maintain stable binocular fixation during head movements. Despite similar functional roles, differences in behavioral, neuroanatomical, and sensory afferent properties suggest that the sensorimotor processing may be partially distinct for the RVOR and TrVOR. To investigate the currently poorly understood neural correlates for the TrVOR, the activities of eye movement-sensitive neurons in the rostral vestibular nuclei were examined during pure translation and rotation under both stable gaze and suppression conditions. Two main conclusions were made. First, the 0.5 Hz firing rates of cells that carry both sensory head movement and motor-like signals during rotation were more strongly related to the oculomotor output than to the vestibular sensory signal during translation. Second, neurons the firing rates of which increased for ipsilaterally versus contralaterally directed eye movements (eye-ipsi and eye-contra cells, respectively) exhibited distinct dynamic properties during TrVOR suppression. Eye-ipsi neurons demonstrated relatively flat dynamics that was similar to that of the majority of vestibular-only neurons. In contrast, eye-contra cells were characterized by low-pass filter dynamics relative to linear acceleration and lower sensitivities than eye-ipsi cells. In fact, the main secondary eye-contra neuron in the disynaptic RVOR pathways (position-vestibular-pause cell) that exhibits a robust modulation during RVOR suppression did not modulate during TrVOR suppression. To explain these results, a simple model is proposed that is consistent with the known neuroanatomy and postulates differential projections of sensory canal and otolith signals onto eye-contra and eye-ipsi cells, respectively, within a shared premotor circuitry that generates the VORs.


Figures
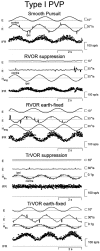
Fig. 1.
Fig. 1.
Responses of a horizontal type I position-vestibular-pause (PVP) neuron during smooth pursuit, yaw rotation, and lateral translation. During head movement, subjects stabilized either a head-fixed (RVOR or TrVOR suppression) or an earth-fixed (0.5 Hz, ±10° ocular deviations) target. The pause of the cell is only evident for one of the largest saccades during RVOR suppression (fast changes in eye position are usually ≪1° during all experimental paradigms). From top tobottom, right eye position (E), right eye velocity (), stimulus (head velocity,ang for rotation and head acceleration, linfor translation), and instantaneous firing rate (IFR) of the neuron are shown. RVOR, Rotational vestibulo-ocular reflex; sp, spikes; TrVOR, translational VOR.
Fig. 2.
Fig. 2.
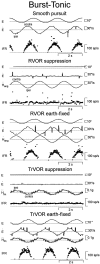
Responses of a horizontal burst-tonic (BT) cell with contralateral eye movement sensitivity during horizontal smooth pursuit, head rotation, and translation. During head movement, subjects stabilized either a head-fixed (RVOR or TrVOR suppression) or an earth-fixed (0.5 Hz, ±10°) target. See Figure 1 legend for other abbreviations.
Fig. 3.
Fig. 3.
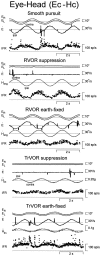
Responses of a horizontal eye-head cell with contralateral eye movement sensitivity (Ec-Hc) during horizontal smooth pursuit, head rotation, and translation. During head movement, subjects stabilized either a head-fixed (RVOR or TrVOR suppression) or an earth-fixed (0.5 Hz, ±10°) target. See Figure 1legend for other abbreviations.
Fig. 4.
Fig. 4.
Responses of two neurons with ipsilateral eye movement sensitivity. A, A type II PV/PVP.B, An eye-head (Ei-Hi) cell. Cell responses during horizontal smooth pursuit, RVOR suppression, and TrVOR suppression (0.5 Hz) are shown. See Figure 1 legend for abbreviations.
Fig. 5.
Fig. 5.
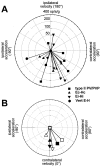
Response sensitivity and phase during lateral TrVOR suppression are plotted in polar coordinates for the horizontal type II PV/PVP, Ec-Hc, and Ei-Hi cells and one vertical E-H cell that exhibited clear response modulations during stabilization of a head-fixed target. A, Individual neuron responses at 0.5 Hz (±0.2 g) are shown. B, Average responses for the type II PV/PVP, Ec-Hc, and Ei-Hi neurons are compared for 0.5 and 2 Hz translational stimuli (solidand open symbols, respectively). Sensitivity has been expressed in spikes · second−1 · gravity−1(g = 9.81 m/sec2). Phase has been expressed relative to contralaterally directed head velocity.Vert, Vertical. See previous figure legends for other abbreviations.
Fig. 6.
Fig. 6.
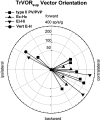
Distribution of maximum sensitivity vector orientations during translations in the horizontal plane for the horizontal type II PV/PVP, Ec-Hc, and Ei-Hi cells and one vertical E-H cell that exhibited clear response modulations during TrVOR suppression at 0.5 Hz. Vector sensitivity is expressed in spikes · second−1 · gravity−1(g = 9.81 m/sec2).sup, Suppression. See previous figure legends for other abbreviations.
Fig. 7.
Fig. 7.
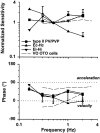
Response dynamics of eye-ipsi and eye-contra cells during TrVOR suppression. The mean (±SD) response sensitivity (top) and phase (bottom) for translation in the maximum sensitivity direction are plotted as a function of frequency for five type II PV/PVP, two Ec-Hc, and four Ei-Hi cells.Dashed lines are used to illustrate the mean sensitivity and phase from two groups of otolith-only (i.e., not eye movement-sensitive) neurons that exhibited high-pass and flat dynamics and were recorded rostrally in the vestibular nuclei, in the vicinity of the eye movement cells of the present study (Angelaki and Dickman, 2000). Phases of 0° (linear velocity) and 90° (linear acceleration) are indicated with dotted horizontal lines. Sensitivities are expressed in spikes · second−1 · gravity−1(g = 9.81 m/sec2) and normalized to a gain of unity at 0.5 Hz before the calculation of each average. Phase values were expressed relative to translational head velocity in the interval of –90 to +90°, independently of whether the firing rate of a given cell increased for ipsilaterally or contralaterally directed head movements. VO OTO, Vestibular-only otolith neurons. See previous figure legends for other abbreviations.
Fig. 8.
Fig. 8.
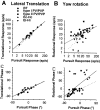
Functional distinction between sensory and motor signals during lateral translation (A) and yaw rotation (B). This is illustrated by plotting the peak firing rate (top) and phase (bottom) during movement while an animal fixated a central earth-fixed target versus the corresponding peak firing rate and phase during horizontal smooth pursuit with the animal stationary. The stimuli during translation and rotation were adjusted such that the elicited eye movements were close to identical to those during smooth pursuit (0.5 Hz, ±10°). Different symbols are used for different classes of cells (BT, type I PV/PVP, type II PV/PVP, Ec-Hc, and Ei-Hi).Opensymbols in Acorrespond to the few (3) cells that were tested for both stable gaze and suppression conditions and exhibited small but consistent responses during TrVOR suppression (22–68 spikes · sec−1 · g−1).Dotted lines with unity slope indicate equal responses during head movement and pursuit. Solid lines are linear regressions (A, top, slope = 0.89, R2 = 0.94; A, bottom, slope = 0.98,R2 = 0.77; B, top, slope = 0.55,R2 = 0.28; B, bottom, slope = 1.61,R2 = 0.30). See previous figure legends for abbreviations.
Fig. 9.
Fig. 9.
Feedfoward and feedback models of the RVOR (A, B) (Skavenski and Robinson, 1973; Robinson, 1981;Galiana and Outerbridge, 1984) and the RVOR and TrVOR (C, D) [modified following Green and Galiana (1998); Musallam and Tomlinson (1999)]. The neural filterF(s) represents an internal model of the eye plant [i.e., F(s) = P(s)] that is presumed to exist in the nucleus prepositus hypoglossi (PH). Parameter Tp in A andC is chosen to provide neural compensation for the low-pass filter dynamics of the eye plant (Robinson, 1981), whereas parameters a and b in Band D are set to provide an appropriate RVOR gain and integrator time constant (Galiana and Outerbridge, 1984).C(s), Semicircular canals;E, eye position; E*, efference copy or internal estimate of E; EM, eye movement-sensitive vestibular neurons;ang, angular head velocity;lin, linear head acceleration; MN, extraocular motoneurons;O(s), otolith organs;VO, vestibular-only neurons. See previous figure legends for other abbreviations.
Fig. 10.
Fig. 10.
Proposed model of the VORs. A, Schematic of the feedback realization of the eye plant hypothesis (Fig.9D) (Green and Galiana, 1998) that has been extended here to include both lumped eye-ipsi (EMI)- and eye-contra (EMC)-sensitive cell types. Thedotted line indicates an assumed weak projection from EMI cells to the ipsilateral abducens to account for the disynaptic utriculo-ocular pathways (Uchino et al., 1994, 1996). Thedashed line indicates an inhibitory projection from PH neurons [i.e., at the output ofF(s)] to the contralateral abducens (McCrea and Baker, 1985; Langer et al., 1986; Escudero and Delgado-Garcia, 1988) that may account for the inhibitory polysynaptic utriculoabducens pathway (Uchino et al., 1997). B, Actual model structure based on the schematic in A that was used to examine the predicted responses of the EMC and EMI cell types under different visual-vestibular interaction conditions. Dashed pathways associated with visuomotor areas (VM) are activated by the presence of a visual target and represent a simplified lumped pursuit system (Green and Galiana, 1998, 1999; Green, 2000). Negative signs denote projections that on the basis of anatomy are presumed to be either inhibitory to the ipsilateral side of the brain or excitatory to the contralateral side of the brain. Similarly, positive projections (i.e., no negative sign) are assumed to be either excitatory to the ipsilateral side or inhibitory to the contralateral side of the brain. Because the projections in the positive feedback loop interconnecting the EMC and EMI cells are illustrated as negative (inhibitory), both cell types should be assumed to be located on the same side of the brain in interpreting model simulations. Vestibular stimulation is provided by the angular head velocityang, sensed by the semicircular canals, C(s) =Tcs/(Tcs+ 1), and linear head accelerationlin, sensed by the otolith organs, O(s) = 1/(Tos + 1). The negative sign at the output of O(s) indicates that afferents associated with the medial portions of the utricular maculae (excited for contralaterally directed translation) are assumed to provide the TrVOR drive.Tconj describes the conjugate target position in a head-fixed reference frame. The neural filter,F(s) =Kf/(Tfs+ 1), represents an internal model of the eye plant,P(s) =Kp/(Tps+ 1), when Tf =Tp. The output of the model,E, represents conjugate eye position. Model parameters are as follows: a = 0.19, b = 0.75, d1 = 0.21,d2 = 1.1, e = 0.03,Kp = 1,Kf = 2.81,Kv = 9.51, p = 1,q = 0.27, r1 = −0.1, r2 = 0.1,Tf = 0.25,Tp = 0.25,Tc = 5, andTo = 0.0159. Note that to simulate appropriate responses for a vergence angle of 6.4°, the primary otolith projection weight q was adjusted to produce a TrVOR gain of 1.2 cm/° at 4 Hz (equivalent to a TrVOR gain of 0.32 cm · degree−1 · MA−1). MA, Meter-angles, defined as the reciprocal of viewing distance in meters. See previous figure legends for other abbreviations.
Fig. 11.
Fig. 11.
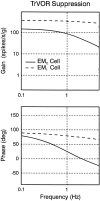
Predicted frequency response plots for the EMC and the EMI cell types (solid and dashed lines, respectively) in the model of Figure 10B during TrVOR suppression. Cell response gains are expressed relative to translational head acceleration. The response phase of the EMI cell is expressed relative to contralaterally directed head velocity, whereas the EMC cell response phase is expressed relative to ipsilaterally directed head velocity. See previous figure legends for abbreviations.
Fig. 12.
Fig. 12.
Simulated EMC and EMIcell responses in the model of Figure 10B for 0.5 Hz pursuit (A), earth-fixed target stabilization during head translation (B), and earth-fixed target stabilization during head rotation (C). Target or head movement stimuli were adjusted in all cases to elicit ocular deviations of ±10° for a vergence angle of 6.4° (as in our experimental conditions). Assuming the convention that leftward ocular deviations are positive, the model EMC and EMIcell populations are both presumed to be located in the left vestibular nucleus. Hence, EMC cells are excited for contralaterally directed eye movements, whereas EMI cells are excited for ipsilaterally directed ocular deviations. See previous figure legends for abbreviations.
Fig. 13.
Fig. 13.
Postulated relationship between specific cell groups and disynaptic utriculoabducens connectivity. Thevertical dashed line represents the midline. Thedashed line from Ec-Hc cells to the ipsilateral AB represents an inhibitory projection. The question marksillustrate postulated but undocumented weak excitatory projections from the type II PV/PVP and Ei-Hi neurons to the ipsilateral abducens nucleus. Polysynaptic connectivities are not included.AB, Abducens nucleus. See previous figure legends for other abbreviations.

Similar articles

Cited by

References

    1. Angelaki DE. Dynamic polarization vector of spatially tuned neurons. IEEE Trans Biomed Eng. 1991;38:1053–1060. - PubMed
    1. Angelaki DE. Three-dimensional organization of otolith-ocular reflexes in rhesus monkeys. III. Responses to translation. J Neurophysiol. 1998;80:680–695. - PubMed
    1. Angelaki DE, Dickman JD. Spatiotemporal processing of linear acceleration: primary afferent and central vestibular neuron responses. J Neurophysiol. 2000;84:2113–2132. - PubMed
    1. Angelaki DE, Hess BJM (2001) Direction of heading and vestibular control of binocular eye movements. Vision Res, in press. - PubMed
    1. Angelaki DE, McHenry MQ. Short-latency primate vestibulo-ocular responses during translation. J Neurophysiol. 1999;82:1651–1654. - PubMed

Publication types

MeSH terms

LinkOut - more resources