. 2001 Jun 1;21(11):4002-15.
doi: 10.1523/JNEUROSCI.21-11-04002.2001.

Rules of connectivity between geniculate cells and simple cells in cat primary visual cortex

Affiliations

Rules of connectivity between geniculate cells and simple cells in cat primary visual cortex

J M Alonso et al. J Neurosci. .

Abstract

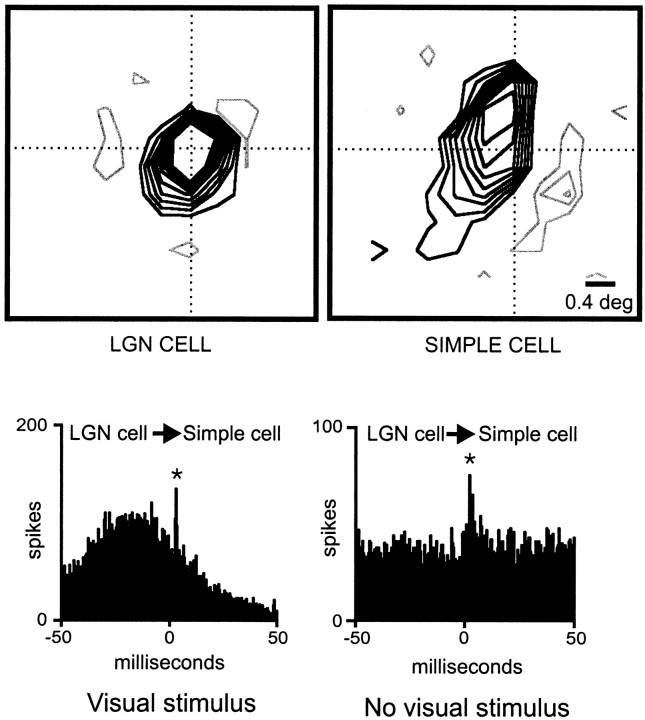
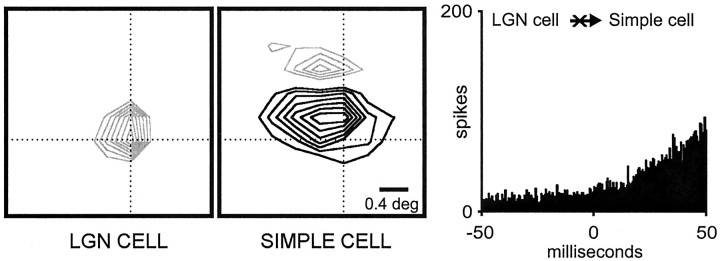
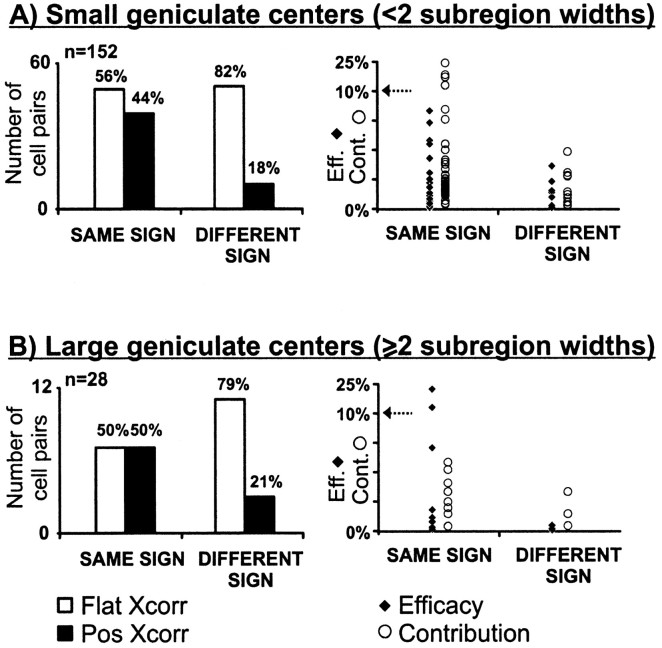
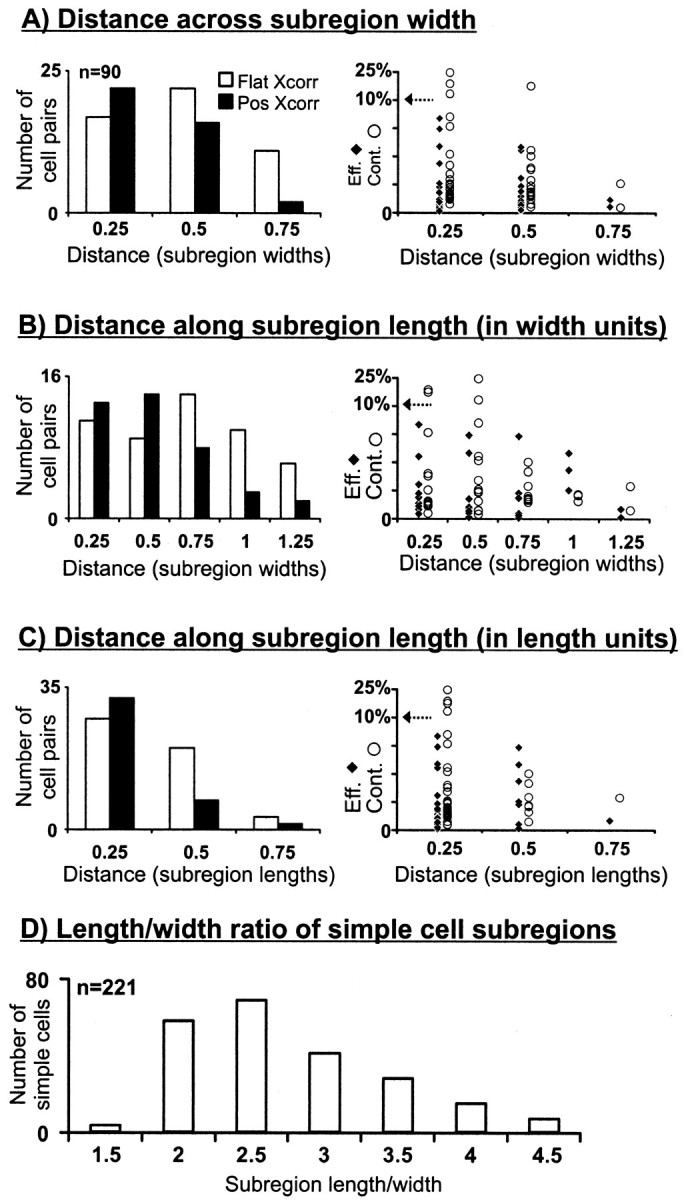
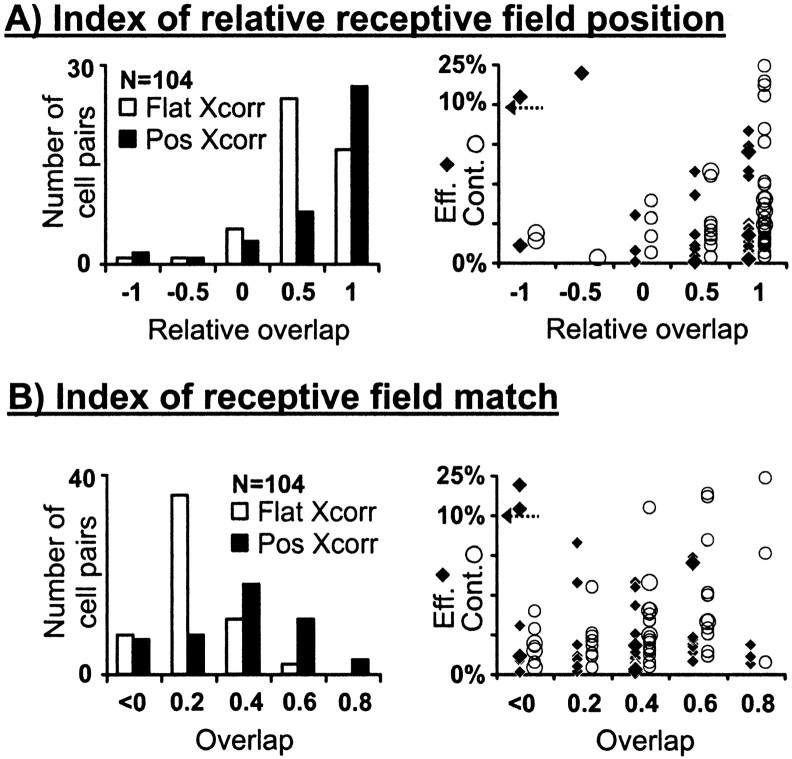
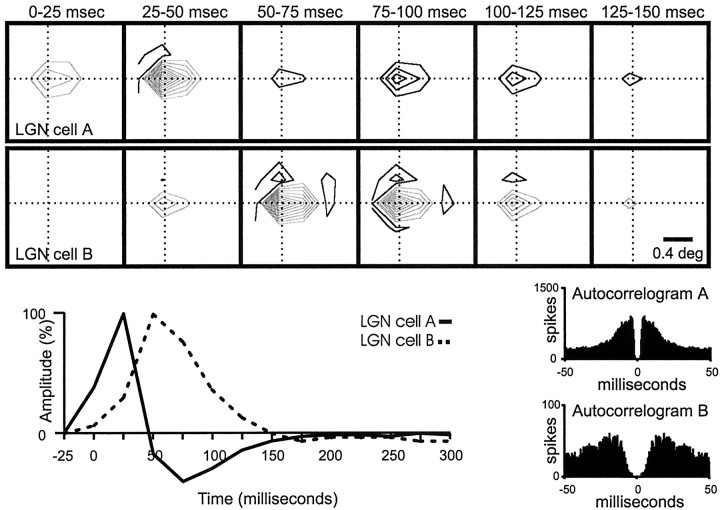
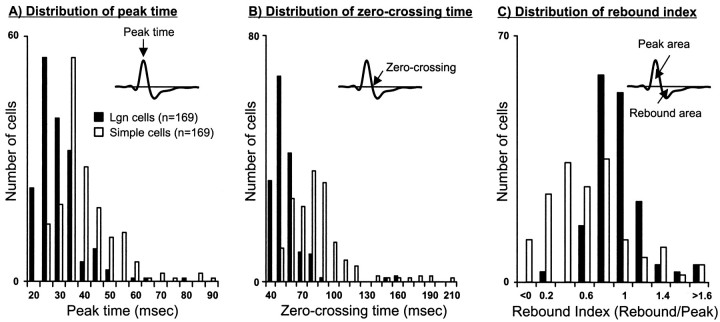
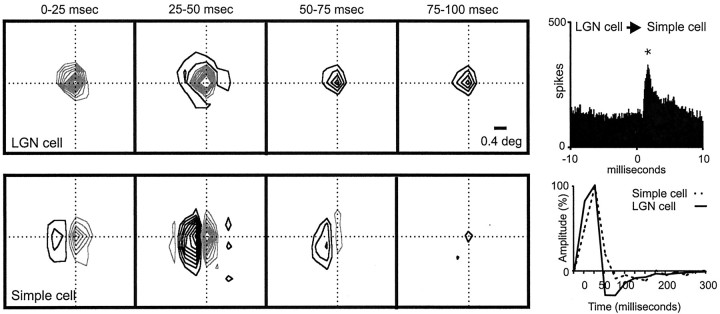
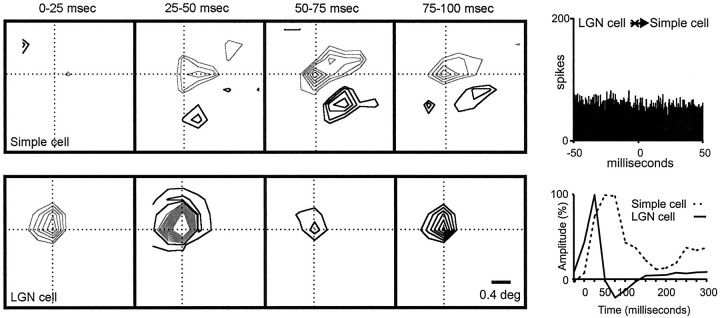
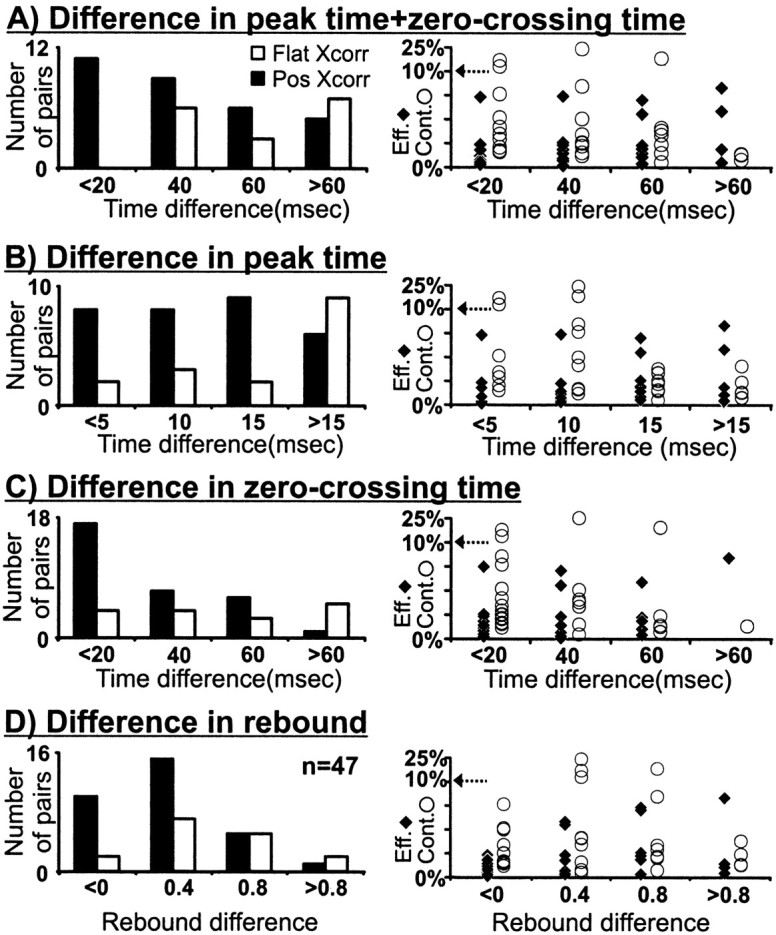
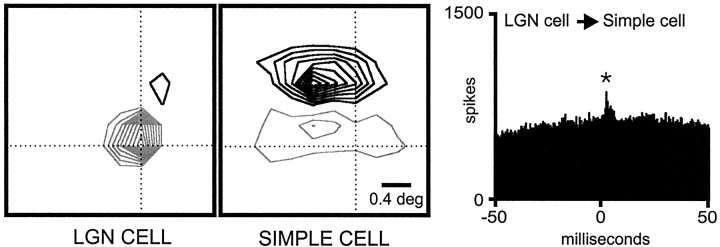
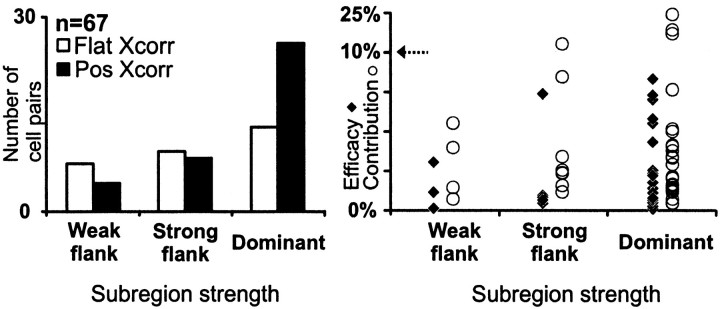
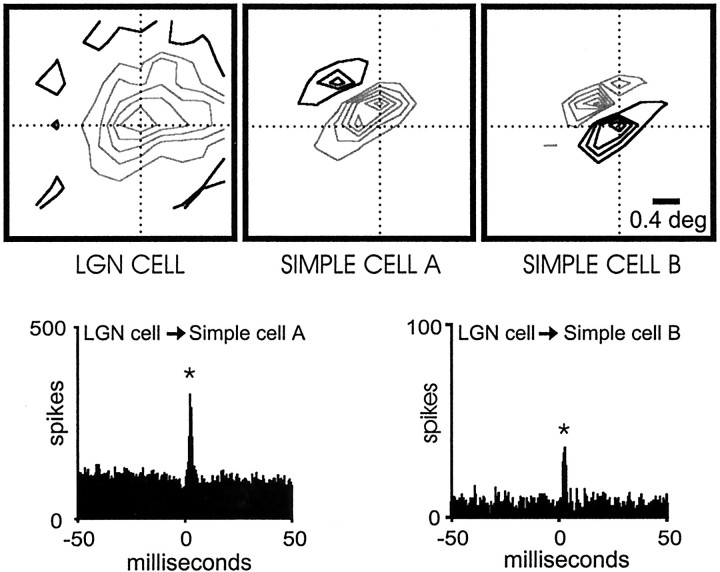
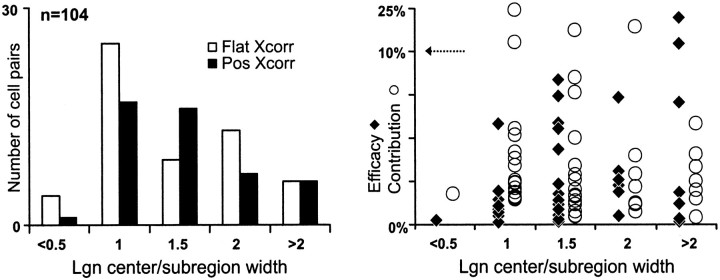
Hundreds of thalamic axons ramify within a column of cat visual cortex; yet each layer 4 neuron receives input from only a fraction of them. We have examined the specificity of these connections by recording simultaneously from layer 4 simple cells and cells in the lateral geniculate nucleus with spatially overlapping receptive fields (n = 221 cell pairs). Because of the precise retinotopic organization of visual cortex, the geniculate axons and simple-cell dendrites of these cell pairs should have overlapped within layer 4. Nevertheless, monosynaptic connections were identified in only 33% of all cases, as estimated by cross-correlation analysis. The visual responses of monosynaptically connected geniculate cells and simple cells were closely related. The probability of connection was greatest when a geniculate center overlapped a strong simple-cell subregion of the same sign (ON or OFF) near the center of the subregion. This probability was further increased when the time courses of the visual responses were similar. In addition, the connections were strongest when the simple-cell subregion and the geniculate center were matched in position, sign, and size. The rules of connectivity between geniculate afferents and simple cells resemble those found for retinal afferents to geniculate cells. The connections along the retinogeniculocortical pathway, therefore, show a precision that goes beyond simple retinotopy to include many other response properties, such as receptive-field sign, timing, subregion strength, and size. This specificity in wiring emphasizes the need for developmental mechanisms (presumably correlation-based) that can select among afferents that differ only slightly in their response properties.


Figures

Fig. 1.
Fig. 1.
Monosynaptic connection between a geniculate cell and a simple cell with overlapping receptive fields of the same sign.Top, The receptive fields of the geniculate cell and the simple cell are shown as contour plots (gray lines, ON response; black lines, OFF response). The dotted cross marks the center of the geniculate receptive field. Both receptive fields were plotted at the same delays between stimulus and response (35–50 msec). The stimulus was updated every 15.5 msec. Bottom, Cross-correlograms show a fast positive peak displaced from zero, indicating a monosynaptic connection. When a drifting grating is used as a visual stimulus (left), the positive peak is superimposed on a slow stimulus-dependent correlation. In the absence of visual stimulation (right), the positive peak is seen superimposed on aflat baseline. The asterisk indicates that the positive peak was statistically significant (see Materials and Methods). Number of geniculate spikes: 10,310 (visual stimulus, drifting grating) and 9728 (no visual stimulus); number of simple-cell spikes: 3777 (visual stimulus) and 3927 (no visual stimulus). Bin width, 0.5 msec.
Fig. 2.
Fig. 2.
Geniculate cell and simple cell with spatially overlapping receptive fields of different sign that are not connected.Left, Middle, Receptive fields are shown. Conventions are described in Figure 1. Both receptive fields were plotted at the same delays between stimulus and response (32–52 msec). The stimulus was updated every 20 msec. Right, Flat correlation indicates the absence of a direct excitatory connection. Number of geniculate spikes: 67,111; number of simple-cell spikes: 8544. Bin width, 0.5 msec.
Fig. 3.
Fig. 3.
Distribution of cell pairs with respect to receptive-field sign. Left, Number of connected (positive cross-correlation) and nonconnected (flat cross-correlation) cell pairs for geniculate cells with small (A) and large (B) receptive fields. Small geniculate centers are smaller than two simple-cell subregion widths. Large geniculate centers are larger than two simple-cell subregion widths. Total number of cell pairs, 180. Total number of positive correlations, 61. The percentages within each group are shown at thetop of each histogram bar.Right, The efficacy and contribution from each connection. The arrow indicates a compression of they-axis. Below the arrow, each division is 2.5%. Above the arrow, the scale is contracted by a factor of six. Cont., Contribution (open circles); Eff., efficacy (filled diamonds); Flat Xcorr, flat cross-correlation (open bar);Pos Xcorr, positive cross-correlation (filled bar).
Fig. 4.
Fig. 4.
Distribution of cell pairs with respect to the distance between their receptive fields. Number of connected (positive cross-correlation) and nonconnected (flat cross-correlation) cell pairs as a function of the distance between the LGN center and the peak of the simple-cell subregion, in both width and length, is shown.A, B, Distances were measured in units of simple-cell subregion widths. C, Because simple cells had differing aspect ratios (length/width), the distance in length is also given in units of subregion length. Only cell pairs with receptive fields of the same sign (e.g., ON superimposed with ON) and with small geniculate centers (<2 subregion widths) were selected (n = 90). Efficacies and contributions are shown to theright, as described in Figure 3. D,Histogram of aspect ratios for all overlapped subregions (n = 221; mean, 2.5 ± 0.8; median, 2.3) is shown. In A–D, single numerical valuesunder histogram bars indicate the upper limit in a range.
Fig. 5.
Fig. 5.
Distribution of connected cell pairs with respect to the normalized dot product of their receptive fields. Two forms of normalized dot products are shown (see Materials and Methods).A, The relative overlap. B, The overlap. The relative overlap is 1.0 if the two different receptive fields are in the optimal relative position. The overlap is 1.0 if the two receptive fields are identical. Data shown are only for pairs with same-sign overlapped subregions (n = 104). Efficacies and contributions are shown to the right (as described in Fig. 3); data points from large receptive fields (>2 subregion widths) are shown with large symbols.
Fig. 6.
Fig. 6.
Receptive fields and impulse responses from two neighboring geniculate cells. Spatially the receptive fields are very similar, but their timing is different. Top, A series of receptive-field frames calculated for each geniculate cell at different times after the stimulus is shown. Bottom, Left, The impulse responses (biphasic for cell A and monophasic for cell B) are shown. The labels on thex-axis show the lower limit of the time interval during which the stimulus was presented (e.g., 0 indicates 0–25). The stimulus was updated every 25 msec. Although not tested explicitly, the two cells most likely correspond to nonlagged (cell A) and partially lagged (cell B) cell types (Cai et al., 1997; Wolfe and Palmer, 1998). Right, Autocorrelograms are shown for each geniculate cell. The gap in the middle of the autocorrelogram is longer for cell B than forcell A, which indicates a longer refractory period. Number of spikes in the autocorrelogram of cell A: 21,698; number of spikes in the autocorrelogram of cell B: 4296.
Fig. 7.
Fig. 7.
Distribution of geniculate cells and simple cells with respect to the timing of their responses. The distribution of three parameters derived from impulse responses of geniculate and cortical neurons is shown. A, Peak time.B, Zero-crossing time. C, Rebound index. Peak time is the time with the strongest response in the first phase of the impulse response. Zero-crossing time is the time between the first and second phases. Rebound index is the area of the impulse response after the zero crossing divided by the area before the zero crossing. Only impulse responses with good signal to noise were included (>5 SD above baseline; n = 169).
Fig. 8.
Fig. 8.
Geniculate center overlapped with a simple-cell subregion of the same sign and similar timing. The two cells were monosynaptically connected. Left, A series of receptive-field frames for the geniculate cell and simple cell is shown. The simple receptive field had two strong subregions that were fast (peak, ∼0–25 msec) and two weaker flanks that were slower (peak, ∼25–50 msec). The ON geniculate center overlapped the ON simple-cell subregion. Right, The impulse responses of the LGN center and simple-cell subregion (summed over all pixels in their intersection) are shown. The labels on the x-axis show the lower limit of the time interval during which the stimulus was presented (e.g., 0 indicates 0–25).Top, The correlogram indicates that the two cells were monosynaptically connected [positive peak with short monosynaptic delay (asterisk)]. Note that the monosynaptic delay is much shorter than could be resolved in the impulse response. Number of geniculate spikes in the cross-correlogram: 38,251; number of simple-cell spikes in the cross-correlogram: 33,453.
Fig. 9.
Fig. 9.
Geniculate center overlapped with a simple-cell subregion of the same sign but different timing. The two cells were not connected. Left, A series of receptive-field frames is shown for the geniculate cell and the simple cell. The simple receptive field had two strong subregions that were slow (peak, ∼50–75 msec). The ON geniculate (peak, ∼25–50 msec) center overlapped a simple-cell subregion of the same sign but different timing.Right, The impulse responses of the LGN center and simple-cell subregion (summed over all pixels in their intersection) are shown. Top, The cross-correlogram is flat, indicating the absence of a direct excitatory connection. Number of geniculate spikes in the correlogram: 40,516; number of simple-cell spikes in the correlogram: 6291.
Fig. 10.
Fig. 10.
Distribution of timing differences between geniculate cells and simple cells among connected and nonconnected cell pairs. Data shown are for cell pairs with well overlapped fields (normalized dot product > 0.50) and impulse responses with good signal to noise (peak ≥ 5 SD), selected from all cell pairs with receptive fields of the same sign (n = 47/104).A, All cells with a similar peak time and zero-crossing time were monosynaptically connected. A–C, Differences in timing parameters are shown as absolute values. Geniculate cells were faster than cortical cells in all but two cases (a connected cell pair with peak time + zero-crossing time < 20 msec and a nonconnected cell pair with peak time + zero-crossing time > 60 msec). D, Differences in the rebound index are given as geniculate − cortex. Five of the 47 geniculate cells selected had large receptive fields (most likely Y cells). Timing differences for the three connected large cells are as follows (peak time + zero-crossing time, peak time, zero-crossing time, rebound index): 23, 11, 12, 0.1; 48, 13, 35, 1.1; and 56, 17, 39, 1.1. Timing differences for the two unconnected large cells are as follows: 79, 17, 62, 0.8; and 186, 26, 160, 0.3. The distributions of peak time, zero-crossing time, and rebound index from the selected cell pairs were very similar to the distributions from the entire sample: for selected cell pairs (geniculate cell, simple cell), peak time (27.38 ± 5.88 msec, 37.85 ± 10.90 msec), zero-crossing time (51.20 ± 9.71 msec, 77.06 ± 24.75 msec), and rebound index (0.87 ± 0.30, 0.74 ± 0.46); and for the entire sample (geniculate cell, simple cell), peak time (27.63 ± 8.65 msec, 38.07 ± 11.00 msec), zero-crossing time (50.54 ± 17.25 msec, 79.77 ± 26.89 msec), and rebound index (0.86 ± 0.31, 0.56 ± 0.53). Conventions are as described in Figures 3 and 4.
Fig. 11.
Fig. 11.
Monosynaptic connection between a geniculate cell and a simple cell. The geniculate center overlaps a simple-cell flank.Left, Middle, The receptive fields for the geniculate cell and the simple cell are shown. The receptive field of the simple cell has a strong OFF subregion and a weaker ON flank (70% of the response of the dominant subregion). Right, The correlogram shows a small but significant positive peak (asterisk) displaced from zero indicating a direct excitatory connection. Number of geniculate spikes in the correlogram: 67,111; number of simple-cell spikes in the correlogram: 29,214. Both receptive fields were plotted at the same delays between stimulus and response (32–52 msec). The stimulus was updated every 20 msec.
Fig. 12.
Fig. 12.
Distribution of connected and nonconnected cell pairs as a function of the response strength from the overlapped simple-cell subregion. We selected only cell pairs in which the strongest pixel of the geniculate receptive field overlapped a pixel of a same-sign simple-cell subregion (n = 67). The dominant subregion is the strongest subregion within the simple receptive field. The strong flank is 50–99% of the response of the dominant subregion. The weak flank is <50% of the response of the dominant subregion.
Fig. 13.
Fig. 13.
Two neighboring simple cells receive input from a common Y geniculate cell. A very large geniculate receptive field overlaps a subregion of the same sign in cell A, but it also overlaps both ON and OFF subregions in cell B. The cell is presumably a Y cell because its center is >2.5 times the width of the subregions of the cortical receptive fields (Stoelzel et al., 2000; Yeh et al., 2000). The two simple cells were recorded with the same electrode. The asterisk indicates a significant monosynaptic peak (see Materials and Methods). Number of spikes: geniculate cell, 12,321; simple cell A, 26,192;simple cell B, 1671. All receptive fields were plotted at the same delays between stimulus and response (32–52 msec). The stimulus was updated every 20 msec.
Fig. 14.
Fig. 14.
Distribution of connected and nonconnected cell pairs as a function of the relative sizes of the receptive fields.Left, Number of connected (positive cross-correlation) and nonconnected (flat cross-correlation) cell pairs as a function of relative receptive-field size for pairs with same-sign overlapped subregions (n = 104) is shown.Right, The probability of finding a monosynaptic connection was slightly higher when the geniculate center was similar to or slightly larger than the simple-cell subregion (ratio, 1–1.5). Conventions are as described in Figures 3 and 4.

Similar articles

Cited by

References

    1. Adelson EH, Bergen JR. Spatiotemporal energy models for the perception of motion. J Opt Soc Am. 1985;2:284–299. - PubMed
    1. Ahmed B, Anderson JC, Douglas RJ, Martin KAC, Nelson JC. Polyneuronal innervation of spiny stellate neurons in cat visual cortex. J Comp Neurol. 1994;341:39–49. - PubMed
    1. Alonso JM, Martinez LM. Functional connectivity between simple cells and complex cells in cat striate cortex. Nat Neurosci. 1998;1:395–403. - PubMed
    1. Alonso JM, Usrey WM, Reid EC. Precisely correlated firing in cells of the lateral geniculate nucleus. Nature. 1996;383:815–819. - PubMed
    1. Borg-Graham LJ, Monier C, Fregnac Y. Visual input evokes transient and strong shunting inhibition in visual cortical neurons. Nature. 1998;393:369–373. - PubMed

Publication types