. 2001 May 15;15(10):1287-98.
doi: 10.1101/gad.884601.

Nongenic, bidirectional transcription precedes and may promote developmental DNA deletion in Tetrahymena thermophila

Affiliations

Nongenic, bidirectional transcription precedes and may promote developmental DNA deletion in Tetrahymena thermophila

D L Chalker et al. Genes Dev. .

Abstract

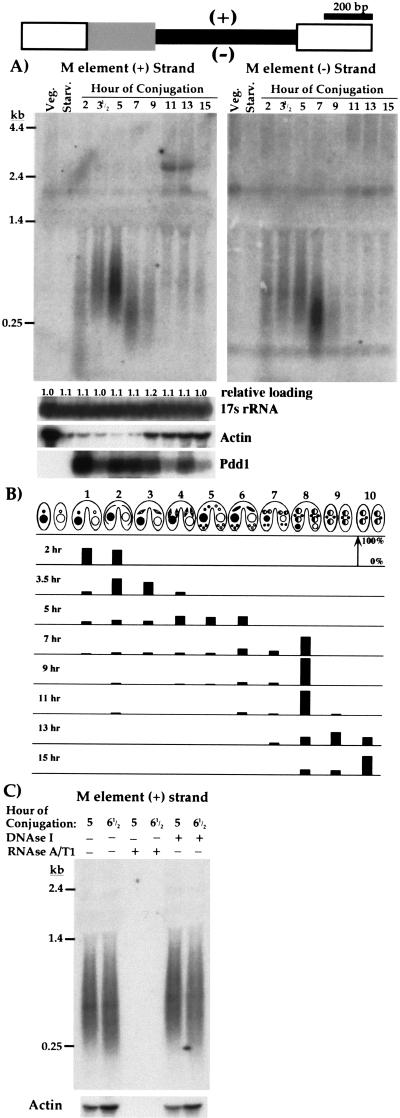
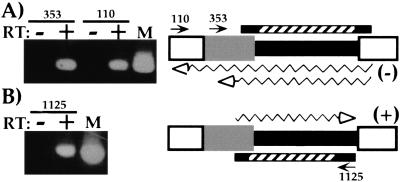
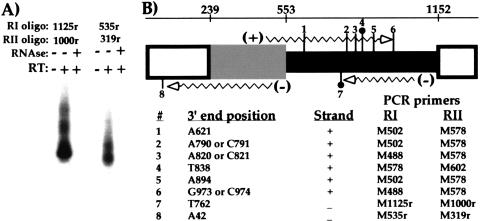
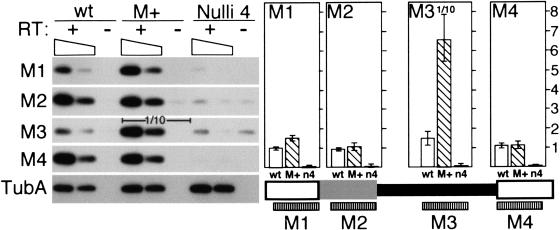
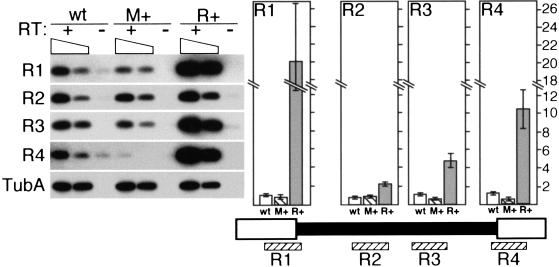
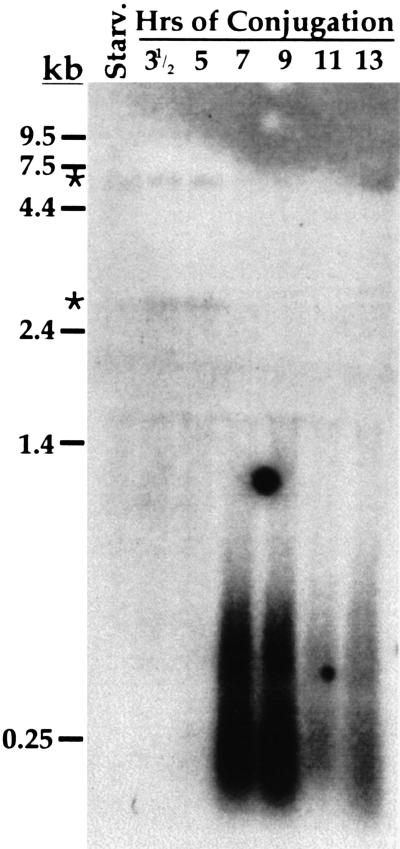
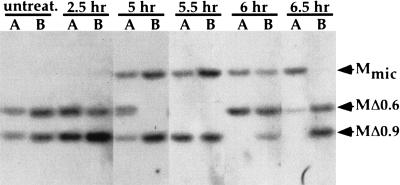
A large number of DNA segments are excised from the chromosomes of the somatic nucleus during development of Tetrahymena thermophila. How these germline-limited sequences are recognized and excised is still poorly understood. We have found that many of these noncoding DNAs are transcribed during nuclear development. Transcription of the germline-limited M element occurs from both DNA strands and results in heterogeneous transcripts of < 200 b to > 1 kb. Transcripts are most abundant when developing micro- and macronuclei begin their differentiation. Transcription is normally restricted to unrearranged DNA of micronuclei and/or developing nuclei, but germline-limited DNAs can induce their own transcription when placed into somatic macronuclei. Brief actinomycin D treatment of conjugating cells blocked M-element excision, providing evidence that transcription is important for efficient DNA rearrangement. We propose that transcription targets these germline-limited sequences for elimination by altering chromatin to ensure their accessibility to the excision machinery.


Figures

Figure 1
Figure 1
The M element is bidirectionally transcribed during conjugation. In the diagram of the M element at the top, the narrow black box represents the 0.6 kbp micronucleus-limited region; the wide, shaded box indicates the 0.3 kbp alternatively eliminated region; the wide, open boxes depict the macronucleus-destined sequences flanking the element. We have arbitrarily designated plus (top) and minus (bottom) strands for the element. (A) Northern blots of total RNA (15 μg/lane) isolated from vegetative, starved, and synchronously conjugating Tetrahymena cells, as indicated above each lane, were hybridized with riboprobes specific to either the plus (left panel) or minus strand (right panel) of the germline-limited sequence. The two panels are separate blots each containing equal aliquots of identically treated RNA. To control for loading uniformity and RNA integrity, blots were stripped and rehybridized with probes specific for 17S rRNA, Actin RNA, and Pdd1 RNA, and the results for the left panel are shown. Quantitation of the 17s rRNA hybridization relative to that of vegetative cell RNA is given above each lane to indicate the relative loading. (B) The percentage of pairs in each cytological stage was determined by fixing an aliquot of cells at the time of RNA isolation in 70% ethanol followed by staining with DAPI (4‘,6-diamino-2-phenylindole dihydrochloride). Within the first hour after mixing, >85% of cells paired. At least 100 pairs at each time point were examined by fluorescence microscopy. The developmental stages of conjugating cells were described initially by Martindale et al. (1982) and are as follows: (1) cell pairing, (2) crescent stage (prophase meiosis I), (3) meiosis I, (4) meiosis II, (5) prezygotic mitosis/nuclear exchange, (6) postzygotic mitosis, (7) macronuclear development I (Mac I), (8) Mac II, (9) Mac II-pair separation, and (10) Mac III. (C) Total RNA isolated from 5 or 6.5 h conjugating cells was treated with RNAseA and T1 or DNAseI before Northern blot analysis as indicated. This blot was hybridized with the plus-strand-specific M-element probe. Identical results were observed with the minus-strand probe (data not shown). Control hybridization with an actin probe is shown below each lane. For blots in A and C, the positions of migration of RNA size standards (GIBCO-BRL) are indicated to the left.
Figure 2
Figure 2
Transcripts initiated outside the 0.6 kbp germline-limited DNA. Representative RT-PCR reactions used to determine the extent of the transcribed region are shown to the left. The locations of the RT primers (arrows) and the regions of the M element amplified (bars) are shown on the diagrams to the right. The M-element shading is as described in Figure 1. The hatched bars denote the regions amplified in the second-round PCR; the solid bar extensions indicate the additional region amplified in the first round of PCR. (A) Minus-strand transcripts were reverse transcribed using M-element-specific oligonucleotides M110–129 or M353–371. (B) Plus-strand transcripts were reverse transcribed with oligonucleotide M1125–1104. All PCR reactions were performed either with or without prior reverse transcription of RNA as indicated. Lane M of each shows PCR reactions using M-element DNA as a positive control for amplification. The inferred minimal size of transcripts amplified is indicated by the wavy arrows drawn either below A or above B in each diagram.
Figure 3
Figure 3
M-element transcripts have heterogeneous, nonpolyadenylated 3′ termini. The 3′ termini of several M-element transcripts were mapped by RNA ligation-mediated PCR. The PCR products generated were cloned and sequenced. Representative reactions are shown in A. Identical reactions were performed either with or without initial reverse transcription or with pretreatment with RNAseA and T1 as indicated. After two rounds of PCR, specific products were detected by Southern blot analysis using an M-element probe. The position of the six plus-strand and two minus-strand 3′ termini are numbered on the diagram of the M element shown in B. The description of the M-element diagram is given in Figure 1. For reference, the nucleotide positions of the boundaries of the M element as defined by the published sequence (Austerberry and Yao 1988) are given on the number line at the top. The two ends, #4 and #7, recovered using the BamHI sequence tagged ligation oligonucleotide (see Materials and Methods) are denoted by the solid circle. The exact nucleotide position of each end as well as the polarity of the transcript is listed below the diagram. In three cases, the exact end of the transcript was ambiguous because the terminal cytosine could have come from the transcript or the ligated oligonucleotide. The two M-element primers used in nested PCR to amplify each end are also given. In no case were extra A nucleotides observed that would indicate polyadenylation of these transcripts.
Figure 4
Figure 4
The M element can induce transcription. The transcription of the M element and immediate flanking DNA was compared between wild-type, M+ (macronuclei containing copies of the M element), and Nulli 4 (micronuclei lacking chromosome 4) strains using semiquantitative RT-PCR. Transcription through four ∼200 bp regions of the element designated M1 through M4 was assayed. For +RT reactions, both the equivalent of 1 μg total RNA (left lane of each) and 0.3 μg of RNA (right lane of each) was assayed, which is indicated by the sloping box. After amplification, PCR products were detected by Southern blot analysis using an M-element probe. Equal reaction amounts were loaded in each lane except for the M3 reaction of M+ strains for which one-tenth the amount was loaded to allow for accurate quantitation between strains. Quantitation is shown to the right directly above the corresponding regions of the M element. Each bar represents the average of at least four independent reactions after correction for background (as measured in the -RT lane) and template amount differences between strains as determined by quantitation of α-tubulin RNA (TubA). The open bar, wild type (wt); hatched bar, M+ lines (M+); solid bar, Nulli 4 strains (n4). The scale is in arbitrary units.
Figure 5
Figure 5
The R element specifically induces its own transcription. The transcription of the R element and immediate flanking DNA was compared between wild-type, M+ (macronuclei containing copies of the M element), and R+ (macronuclei containing copies of the R element) strains using semiquantitative RT-PCR. Transcription through four ∼200 bp regions of the element designated R1 through R4 was assayed. For +RT reactions, both the equivalent of 1 μg total RNA (left lane of each) and 0.3 μg of RNA (right lane of each) was assayed, which is indicated by the sloping box. After amplification, PCR products were detected by Southern blot analysis using an R element probe. Quantitation by phosphorimager analysis is shown to the right directly above the corresponding regions of the R element. Each bar represents the average of at least four independent reactions after correction for background (as measured in the -RT lane) and template amount differences between strains as determined by quantitation of α-tubulin RNA (TubA). The open bar, wild type (wt); hatched bar, M+ lines (M+); shaded bar, R+ lines (R+). The scale is discontinuous and given in arbitrary units.
Figure 6
Figure 6
The repetitive germline-limited sequence of pTt2512 is transcribed. A Northern blot containing total RNA (15 μg/lane) isolated from starved or synchronously conjugating Tetrahymena cells was hybridized with radiolabeled DNA from plasmid pTt2512. The positions of migration of RNA size standards (GIBCO-BRL) are indicated to the left. Asterisks indicate low-abundance transcripts of ∼3 and ∼7 kb detected in starved and conjugating cells that have not been further studied.
Figure 7
Figure 7
Actinomycin D treatment blocks efficient M-element rearrangement. The first two lanes contain DNA of progeny lines of untreated cells. Each successive pair of lanes contains the DNA isolated from two selected progeny lines, A and B, surviving actinomycin D treatment during conjugation. The time of conjugation when actinomycin D was added is indicated above each lane. DNA samples were digested with HindIII, and Southern blots were hybridized with a probe specific to DNA immediately flanking the M element. The position of the DNA fragments corresponding to the unrearranged M element, Mmic, and the two alternatively rearranged forms, MΔ0.6 and MΔ0.9, are indicated by arrowheads. Typically, one or both rearranged forms are present in the macronucleus of each line. The presence of the unrearranged M element in some lines is indicative of failed rearrangement as the micronuclear DNA of these lines is not visible in this exposure.

References

    1. Akhtar A, Zink D, Becker PB. Chromodomains are protein-RNA interaction modules. Nature. 2000;407:405–409. - PubMed
    1. Amrein H, Axel R. Genes expressed in neurons of adult male Drosophila. Cell. 1997;88:459–469. - PubMed
    1. Asai DJ, Forney JD. Tetrahymena thermophila. In: Wilson L, Matsudaira P, editors. Methods in cell biology. San Diego, CA: Academic Press; 1999.
    1. Austerberry CF, Yao MC. Nucleotide sequence structure and consistency of a developmentally regulated DNA deletion in Tetrahymena thermophila. Mol Cell Biol. 1987;7:435–443. - PMC - PubMed
    1. ————— Sequence structures of two developmentally regulated, alternative DNA deletion junctions in Tetrahymena thermophila. Mol Cell Biol. 1988;8:3947–3950. - PMC - PubMed

Publication types

MeSH terms