The effect that genotyping errors have on the robustness of common linkage-disequilibrium measures
- PMID: 11359212
- PMCID: PMC1226131
- DOI: 10.1086/320607
The effect that genotyping errors have on the robustness of common linkage-disequilibrium measures
Abstract
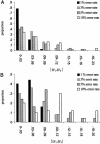
The rapid development of a dense single-nucleotide-polymorphism marker map has stimulated numerous studies attempting to characterize the magnitude and distribution of background linkage disequilibrium (LD) within and between human populations. Although genotyping errors are an inherent problem in all LD studies, there have been few systematic investigations documenting their consequences on estimates of background LD. Therefore, we derived simple deterministic formulas to investigate the effect that genotyping errors have on four commonly used LD measures-D', r, Q, and d-in studies of background LD. We have found that genotyping error rates as small as 3% can have serious affects on these LD measures, depending on the allele frequencies and the assumed error model. Furthermore, we compared the robustness of D', r, Q, and d, in the presence of genotyping errors. In general, Q and d are more robust than D' and r, although exceptions do exist. Finally, through stochastic simulations, we illustrate how genotyping errors can lead to erroneous inferences when measures of LD between two samples are compared.
Figures


References
-
- Akey J, Jin L, Xiong M (2001a) Haplotypes vs. single marker linkage disequilibrium tests: what do we gain? Eur J Hum Genet 9:291–300 - PubMed
-
- Akey JM, Sosnoski D, Parra E, Dios S, Hiester K, Su B, Bonilla C, Jin L, Shriver MD (2001b) Melting curve analysis of SNPs (McSNP): a gel-free and inexpensive approach for SNP genotyping. Biotechniques 30:358–367 - PubMed
-
- Cho RJ, Mindrinos M, Richards DR, Sapolsky RJ, Anderson M, Drenkard E, Dewdney J, Reuber TL, Stammers M, Federspiel N (1999) Genome-wide mapping with biallelic markers in Arabidopsis thaliana. Nat Genet 23:203–207 - PubMed
Publication types
MeSH terms
Grants and funding
LinkOut - more resources
Full Text Sources
Research Materials

