. 2001 Jun 5;98(12):6548-53.
doi: 10.1073/pnas.111536798. Epub 2001 May 22.

Synaptic pattern formation during cellular recognition

Affiliations

Synaptic pattern formation during cellular recognition

S Y Qi et al. Proc Natl Acad Sci U S A. .

Abstract

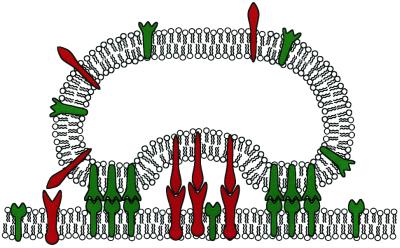
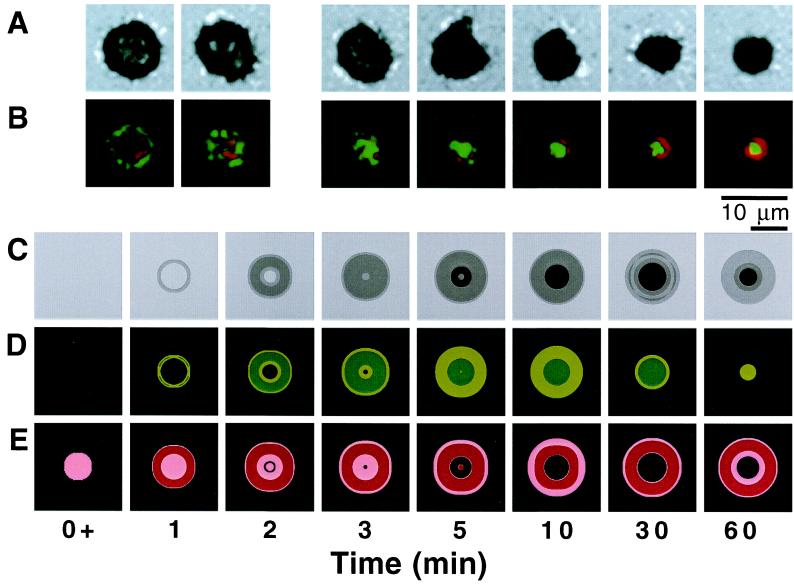
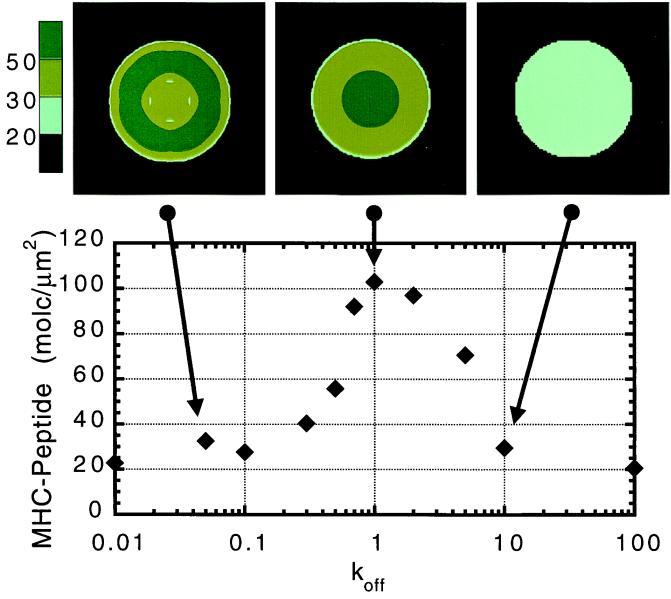
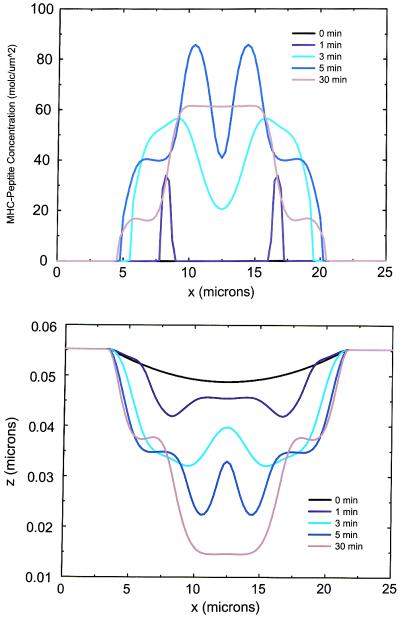
Cell-cell recognition often requires the formation of a highly organized pattern of receptor proteins (a synapse) in the intercellular junction. Recent experiments [e.g., Monks, C. R. F., Freiberg, B. A., Kupfer, H., Sciaky, N. & Kupfer, A. (1998) Nature (London) 395, 82-86; Grakoui, A., Bromley, S. K., Sumen, C., Davis, M. M., Shaw, A. S., Allen, P. M. & Dustin, M. L. (1999) Science 285, 221-227; and Davis, D. M., Chiu, I., Fassett, M., Cohen, G. B., Mandelboim, O. & Strominger, J. L. (1999) Proc. Natl. Acad. Sci. USA 96, 15062-15067] vividly demonstrate a complex evolution of cell shape and spatial receptor-ligand patterns (several microns in size) in the intercellular junction during immunological synapse formation. The current view is that this dynamic rearrangement of proteins into organized supramolecular activation clusters is driven primarily by active cytoskeletal processes [e.g., Dustin, M. L. & Cooper, J. A. (2000) Nat. Immunol. 1, 23-29; and Wulfing, C. & Davis, M. M. (1998) Science 282, 2266-2269]. Here, aided by a quantitative analysis of the relevant physico-chemical processes, we demonstrate that the essential characteristics of synaptic patterns observed in living cells can result from spontaneous self-assembly processes. Active cellular interventions are superimposed on these self-organizing tendencies and may also serve to regulate the spontaneous processes. We find that the protein binding/dissociation characteristics, protein mobilities, and membrane constraints measured in the cellular environment are delicately balanced such that the length and time scales of spontaneously evolving patterns are in near-quantitative agreement with observations for synapse formation between T cells and supported membranes [Grakoui, A., Bromley, S. K., Sumen, C., Davis, M. M., Shaw, A. S., Allen, P. M. & Dustin, M. L. (1999) Science 285, 221-227]. The model we present provides a common way of analyzing immunological synapse formation in disparate systems (e.g., T cell/antigen-presenting cell junctions with different MHC-peptides, natural killer cells, etc.).


Figures

Figure 1
Figure 1
Schematic depiction of a membrane that can undergo shape changes interacting with a planar membrane. Both membranes contain two proteins (red and green) that are mobile within the membrane. The red (green) proteins are complementary to the red (green) proteins on the apposing membrane and can bind to them selectively if they are sufficiently close. The complexes can dissociate. The red and green proteins are of different size. The proteins in the two membranes are initially not complexed. This cartoon depicts a situation observed in experiments (1, 2) during the early stages of T cell synapse formation.
Figure 2
Figure 2
(A) Interference reflection microscopy (IRM) images from experiments (2) with living T cells. The darker shading represents regions with closer apposition of membranes. (B) Experimental fluorescence microscopy images (taken from ref. 2) showing the accumulated concentration of MHC-peptide (green) and ICAM-1 (red). The experimental errors in the concentration measurements are ±5% (M. L. Dustin, personal communication). (C) Model predictions (our calculations) for local distances between the two apposing membranes. The darker shading represents regions with closer apposition of membranes. (D) Model predictions (our calculations) for the accumulated concentration of MHC-peptide (green). The darker green color represents regions where the concentration is greater than 50 molecules/μm2, and the lighter green corresponds to concentrations between 30 and 50 molecules/μm2. The initial uniform MHC-peptide concentration is 20 molecules/μm2. (E) Model predictions (our calculations) for the accumulated concentration of ICAM-1 (red). The darker red color represents regions where the concentration is greater than 120 molecules/μm2, and the lighter red corresponds to concentrations between 40 and 120 molecules/μm2. The initial uniform ICAM-1 concentration is 40 molecules/μm2. The parameters used are detailed in Methods. These particular data correspond to koff = 1 s−1 and DTCR = DLFA-1 = 1 μm2/s. We have carried out calculations for a range of values of the diffusion coefficients for TCR and LFA-1 in the T cell membrane (0.01–1 μm2/s). The basic phenomenology remains the same across this range of values; reduction in the diffusion coefficient by an order of magnitude lowers the protein concentrations at a given time by about 20%. Thus, the specific values of TCR and LFA-1 mobility, while important, are not critical for synaptic pattern formation.
Figure 3
Figure 3
The maximum value of MHC-peptide accumulation at the center of the junction is plotted for values of koff ranging from 0.01–100 s−1 (t1/2 ranging from ≈70–0.007 s). If 55 molecules/μm2 is used as a criterion for efficient synapse formation, the active range for koff falls in a narrow range (0.5–5 s−1). Examples of the spatial distribution of MHC-peptides when the maximum value for MHC-peptide accumulation is reached are also shown. It is evident that the synaptic pattern does not form for koff = 0.05 and 10 s−1. MHC-peptide is concentrated in the central region, with an outer ring of ICAM-1 for values of koff that lead to effective synapse formation.
Figure 4
Figure 4
(A) Detailed concentration profile of bound TCR/MHC-peptide complex along a cross section of the contact region at various times during synapse formation. The concentration is zero initially because we are plotting the concentration of the TCR/MHC-peptide complex. The parameters are the same as those used to obtain the calculated results in Fig. 2. (B) Concomitant evolution of cell shape as measured by the coarse-grained average intermembrane spacing.

References

    1. Monks C R F, Freiberg B A, Kupfer H, Sciaky N, Kupfer A. Nature (London) 1998;395:82–86. - PubMed
    1. Grakoui A, Bromley S K, Sumen C, Davis M M, Shaw A S, Allen P M, Dustin M L. Science. 1999;285:221–227. - PubMed
    1. Davis D M, Chiu I, Fassett M, Cohen G B, Mandelboim O, Strominger J L. Proc Natl Acad Sci USA. 1999;96:15062–15067. - PMC - PubMed
    1. Dustin M L, Cooper J A. Nat Immunol. 2000;1:23–29. - PubMed
    1. Wulfing C, Davis M M. Science. 1998;282:2266–2269. - PubMed

Publication types

Substances