. 2001 May 22;98(11):6494-9.
doi: 10.1073/pnas.101042998.

Perilipin ablation results in a lean mouse with aberrant adipocyte lipolysis, enhanced leptin production, and resistance to diet-induced obesity

Affiliations

Perilipin ablation results in a lean mouse with aberrant adipocyte lipolysis, enhanced leptin production, and resistance to diet-induced obesity

J T Tansey et al. Proc Natl Acad Sci U S A. .

Abstract

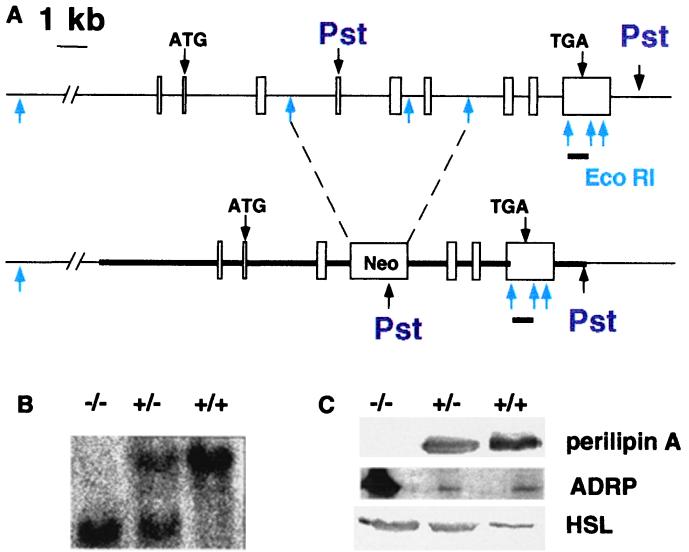
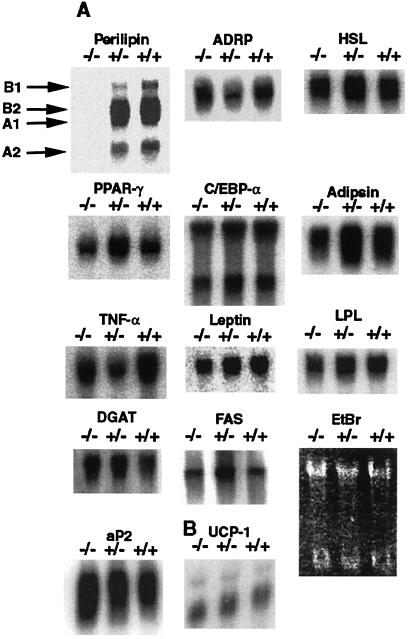
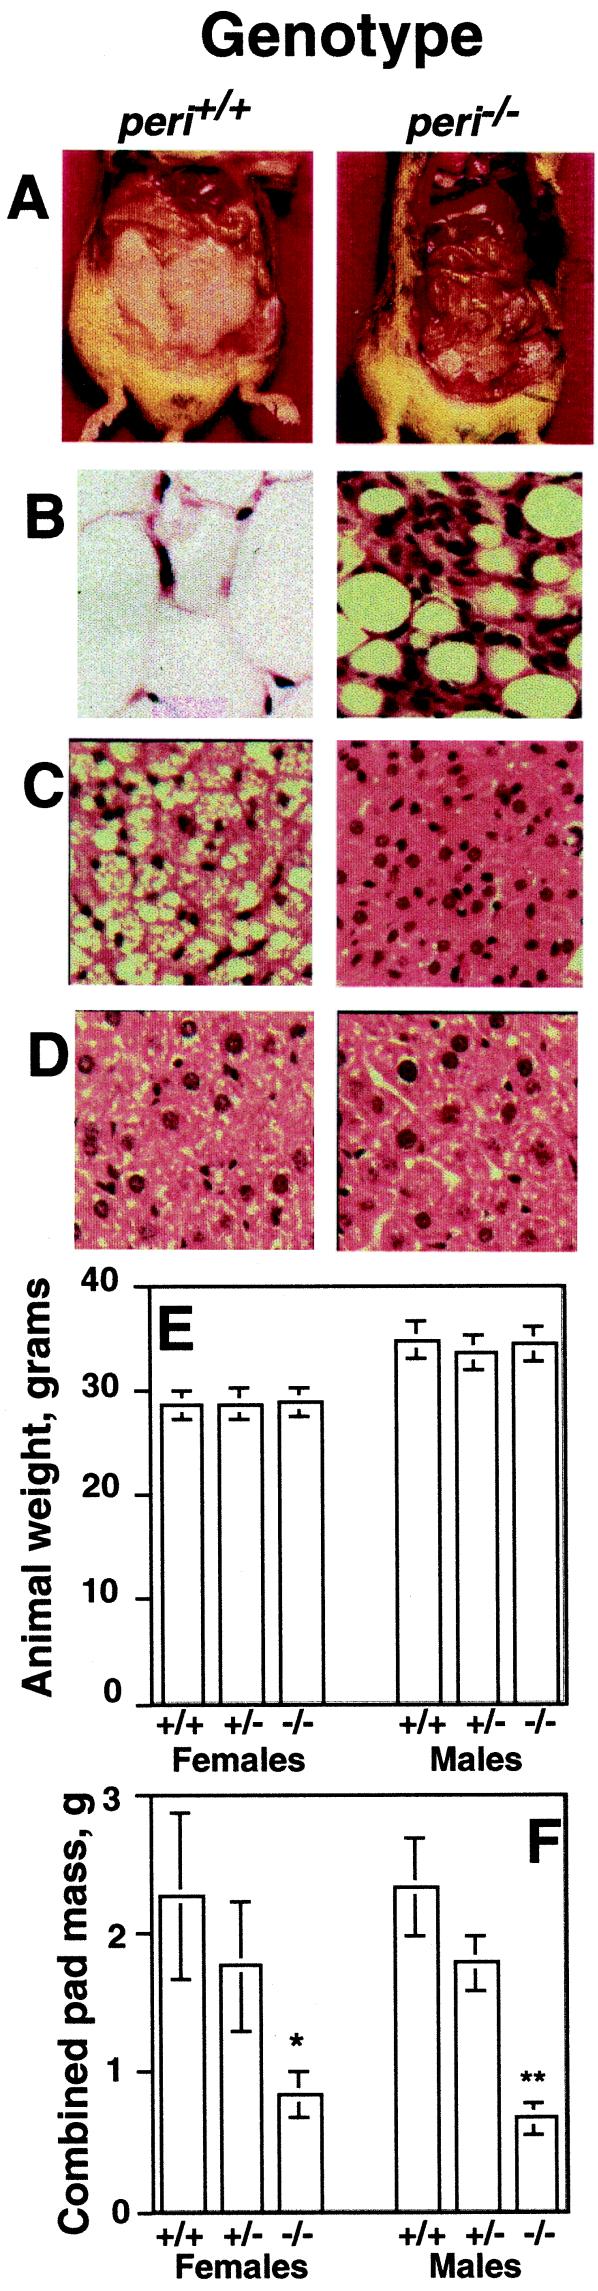
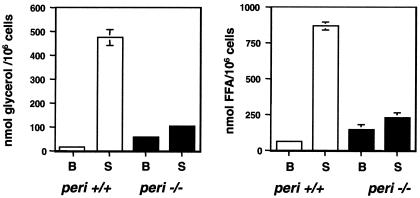
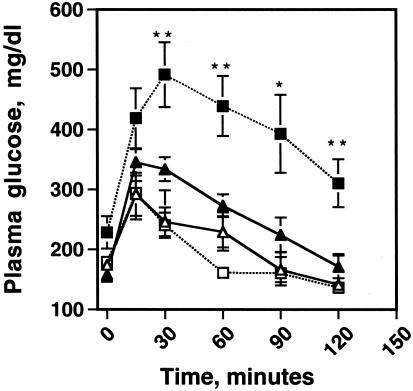
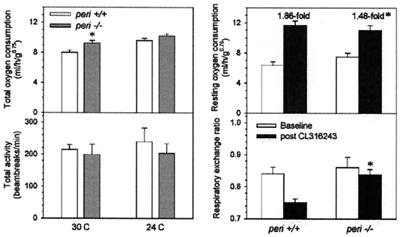
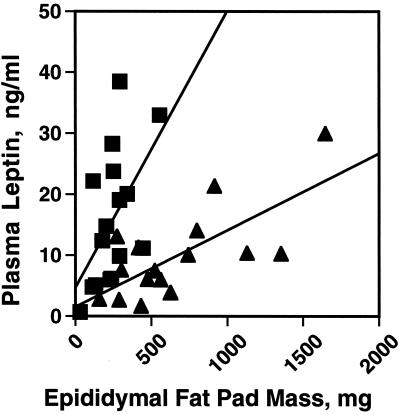
Perilipin coats the lipid droplets of adipocytes and is thought to have a role in regulating triacylglycerol hydrolysis. To study the role of perilipin in vivo, we have created a perilipin knockout mouse. Perilipin null (peri(-/-)) and wild-type (peri(+/+)) mice consume equal amounts of food, but the adipose tissue mass in the null animals is reduced to approximately 30% of that in wild-type animals. Isolated adipocytes of perilipin null mice exhibit elevated basal lipolysis because of the loss of the protective function of perilipin. They also exhibit dramatically attenuated stimulated lipolytic activity, indicating that perilipin is required for maximal lipolytic activity. Plasma leptin concentrations in null animals were greater than expected for the reduced adipose mass. The peri(-/-) animals have a greater lean body mass and increased metabolic rate but they also show an increased tendency to develop glucose intolerance and peripheral insulin resistance. When fed a high-fat diet, the perilipin null animals are resistant to diet-induced obesity but not to glucose intolerance. The data reveal a major role for perilipin in adipose lipid metabolism and suggest perilipin as a potential target for attacking problems associated with obesity.


Figures

Figure 1
Figure 1
Generation of the peri null mouse. (A) Targeted mutation of the murine peri gene. Upper diagram indicates the nine exons in boxes of the peri gene, with translation start and stop sites for the predominant Peri A form (3) and EcoRI and PstI sites. Below is the mutated peri gene with the Neomycin resistance cassette inserted into the EcoRI sites of introns 3 and 6. The position of the insertion would disrupt coding of all four peri mRNA species(X. Lu, J.G.-G., N. G. Copeland, D. J. Gilbert, N. A. Jenkins, C.L. & A.R.K., unpublished work). The region used for homologous recombination is indicated by the thick line. The bar below exon 9 represents the position of the downstream probe used to assess homologous recombination within the peri locus in PstI digests for genomic Southern blots. (B) Southern blotting of tail DNA digested with PstI. (C) Immunoblotting of adipose tissue extracts for peri A, ADRP, and HSL. Adipose tissue samples were extracted and proteins solubilized as described under Experimental Procedures. Gel lanes were loaded with the equivalent of proteins extracted from 10 mg of adipose tissue.
Figure 2
Figure 2
Gene expression in peri+/+, peri+/−, and peri−/− mouse white and brown adipocytes. Northern blot analysis of mRNAs in isolated adipocytes from white adipose tissue and total brown adipose tissue. Scanning of blots revealed that apart from peri, there was less than a 2-fold difference between wt and either heterozygous or peri null mice for each message. (A) Total RNA was obtained from isolated adipocytes from three to five mice for each genotype. Ten micrograms of total RNA of each genotype was electrophoresed, transferred to nylon membranes, and probed with the indicated cDNA probe. Various peri messages are identified according to a recent analysis of the perilipilin gene structure by Lu et al. (X. Lu, J.G.-G., N. G. Copeland, D. J. Gilbert, N. A. Jenkins, C.L. & A.R.K., unpublished work). PPAR-γ, peroxisomal proliferation activated receptor-γ; C/EBP-α, CCATT/enhancer-binding protein-α; TNF-α, tumor necrosis factor-α; aP2, adipocyte lipid-binding protein; LPL, lipoprotein lipase; FAS, fatty acid synthase; DGAT, diacylglycerol acyltransferase. EtBr is a photograph of an ethidium bromide-stained gel. (B) Total RNA was obtained from brown adipose tissue from six animals from each genotype. Ten micrograms of total RNA from each pool were analyzed as above. UCP-1, uncoupling protein-1.
Figure 3
Figure 3
Gross phenotype of the peri null mouse. (A) Representative photographs of abdominal cavities of wt and null mice. Animals shown were weight-matched littermates. Hemotoxylin and eosin stained sections (B) of white adipose tissue, (C) brown adipose tissue, and (D) liver. (E) Body weights of adult male and female animals. (F) Combined masses of reproductive, inguinal, and retroperitoneal fat pads. Values represent means ± SEM for n = 8 animals of each genotype. For fat-pad weights, differences between wt and peri null animals were at P = 0.002 for males and P = 0.02 for females.
Figure 4
Figure 4
Adipocytes from peri null mice exhibit both elevated basal and reduced stimulated lipolysis. Adipocytes were prepared as described in Experimental Procedures. Incubations to measure lipolytic activity contained 1 unit/ml of adenosine deaminse plus 100 nM PIA for basal (B) activity and 10 μM isoproterenol for stimulated (S) activity. Values represent the means ± SEM of quadruplicate determinations of nanomolar glycerol or free fatty acids released per 106 cells per 60 min. For differences in basal fatty acid release between wt and peri null mice, P = 0.013. For all other comparisons between these two phenotypes, P < l0−6. Shown is a typical experiment; error bars not visible were smaller than the thickness of the line describing the data bar.
Figure 5
Figure 5
Peri null animals exhibit a greater tendency toward glucose intolerance than wt mice. Fourteen-week-old male littermates, both wt and perilipin null mice, were fasted overnight and challenged with an i.p. injection of 1 g of glucose per kilogram of body weight. Plasma glucose values were measured at the times indicated after injection by using a Glucometer Elite blood glucose meter (Bayer). Triangles show wt and squares show peri null mice. Open symbols are animals <30 g, and closed symbols are animals >30 g. Values are means ± SEM, n = 6 per group. Student's t test, different from wt: *, P = 0.01, **, P = 0.005.
Figure 6
Figure 6
Metabolic studies. Indirect calorimetry and treatment with CL310243 were performed as described (24) in 13-week-old female peri−/− and littermate wt mice. Left panel data were measured from 6:00 p.m. to 12:00 noon. Data are means ± SEM (n = 6/group). * indicates a difference between peri−/− and corresponding wt mice at P = 0.03 (Upper Left), P = 0.01 (Upper Right), and P = 0.002 (Lower Right).
Figure 7
Figure 7
Altered relationship between plasma leptin concentration and fat-pad weights in peri null mice. Plasma leptin levels of fed wt (triangles) and peri null (boxes) were measured in triplicate in 16 males, 8 at 10 weeks of age and 8 aged 14 weeks, by using an ELISA assay (CrystalChem). The two age groups showed nearly identical data. The average plasma leptin values (mean ± SEM) were: wt mice, 9.9 ± 1.8 ng/ml and peri null mice 16.0 ± 2.8, n = 16. Student's t test, difference between genotypes, P = .013. The slope for the wt curve is 0.013 (r = 0.513) and for the peri null curve, 0.067 (r = 0.713). The two curves are significantly different (P < 0.00028).

References

    1. Servetnick D A, Brasaemle D L, Gruia-Gray J, Kimmel A R, Wolff J, Londos C. J Biol Chem. 1995;270:16970–16973. - PubMed
    1. Greenberg A S, Egan J J, Wek S A, Moos M C, Jr, Londos C, Kimmel A R. Proc Natl Acad Sci USA. 1993;90:12035–12039. - PMC - PubMed
    1. Londos C, Brasaemle D L, Schultz C J, Segrest J P, Kimmel A R. Semin Cell Dev Biol. 1999;10:51–58. - PubMed
    1. Brasaemle D L, Rubin B, Harten I A, Gruia-Gray J, Kimmel A R, Londos C. J Biol Chem. 2000;275:38486–38493. - PubMed
    1. Souza S C, de Vargas L M, Yamamoto M T, Lien P, Franciosa M D, Moss L G, Greenberg A S. J Biol Chem. 1998;273:24665–24669. - PubMed

Publication types

MeSH terms